Enterprise Distribution

5
US has the most total revenue in the world
5/47
Enterprise Distribution

6
US semiconductors companies mostly come from California
6/47
Typical Firm Performance by Region - Profit Distribution

7
The companies in Idaho (i. e. Micron) are much bigger than others
7/47
Concentration and Competition Intensity - Total Revenue - Semiconductors, US, 2020

8
US semiconductors are getting more and more competitive (less dominated by few companies)
8/47
Concentration and Competition Intensity - Four-firm Concentration Ratio

9
US may have more opportunities and higher competition than Taiwan. Taiwan is relatively monopolized.
9/47
Industrial Trend - Industry Total Size

11
US's total revenue and profits are higher than Taiwan
11/47
Industrial Trend - Profitability

12
The US performs better on gross margin, while Taiwan has higher operating margin and net margin, possible because the US companies keep investing in their business operations (hiring more people, buying more equipment)
12/47
Industrial Trend - Efficiency

13
US vs. Taiwan, 2020, semiconductor, efficiency. Overall, US is a pooper performer in inventory days, cash cycle, and return on assets. The asset turnover was more fluctuated.
13/47
Industrial Trend - Financial Health

14
US vs. Taiwan, 2020, semiconductor, financial health. US has a better current ratio and liability asset ratio, but Taiwan has much more operating cash and total cash.
14/47
Industrial Comparison - Profitability (2020)

16
Semiconductors make more revenue than Semiconductor Equipment
16/47
Industrial Comparison - Growth (2020)

17
Semiconductor Equipment has much better growth
17/47
Industrial Comparison - Efficiency (2020)

18
semiconductor Equipment has slightly poorer labor productivity & inventory turnover but better ROA
18/47
Operating Profit vs. Cost - Semiconductors, US, 2020

20
The analysis better shows the probability. Intel is highly profitable relative to others. TXN is also above the average.
20/47
Operating Profit vs. Total Assets - Semiconductors, US, 2020

21
Intel is still the largest in both operating profit and assets
21/47
Operating Margin vs. Revenue - Semiconductors, US, 2020

22
Intel has the highest revenue and if the only frontier in its revenue class. TXN is the profit frontier (best operating margin) in the revenue class.
22/47
Return on Assets vs. Liability Asset Ratio - Semiconductors, US, 2020

23
Intel is in about the middle in terms of ROA and financial health. QCOM has the best financial health, which means it may put itself at risk of defaulting on its loans if interest rates were to rise suddenly. TXN is the best performer in ROA, following AMD.
23/47
Revenue vs. Cost - Semiconductors, US, 2020

24
Intel has much more cost & revenue than the average.
24/47
Enterprise Ranking - Total Revenue

26
Intel is the #1 in total revenue. Its revenue is way higher than others
26/47
Enterprise Ranking - Operating Margin

27
TXN has the best Operating Margin (>40%). Intel is ranked #3 (31%).
27/47
Enterprise Ranking - Return on Assets

28
Intel: 7th in ROA (1.4%). TXN is ranked #1 (2.9%). AMD and NVIDIA are both better than Intel.
28/47
Profitability Distribution by Industry

29
Intel is around the middle
29/47
Enterprise Comparison - Size

31
Intel is obviously the highest in everything included
31/47
Enterprise Comparison - Profitability

32
Intel has the lowest ROA. Intel performs the best in Operating Margin and NVDA is slightly behind
32/47
Enterprise Comparison - Return on Investment

33
AMD beat Intel and NVDA in ROI
33/47
Enterprise Comparison - Key Indicators

34
Intel has an exceptionally slow total revenue growth rate and has the best inventory turnover and payable days/receivable days.
34/47
KPI Examination

35
Intel has normal to high profit, normal financial health, normal growth, and good operational efficiency. Overall Intel is not bad.
35/47
Enterprise Trend - Size

37
All Revenues and Operating Incomes are increasing.
37/47
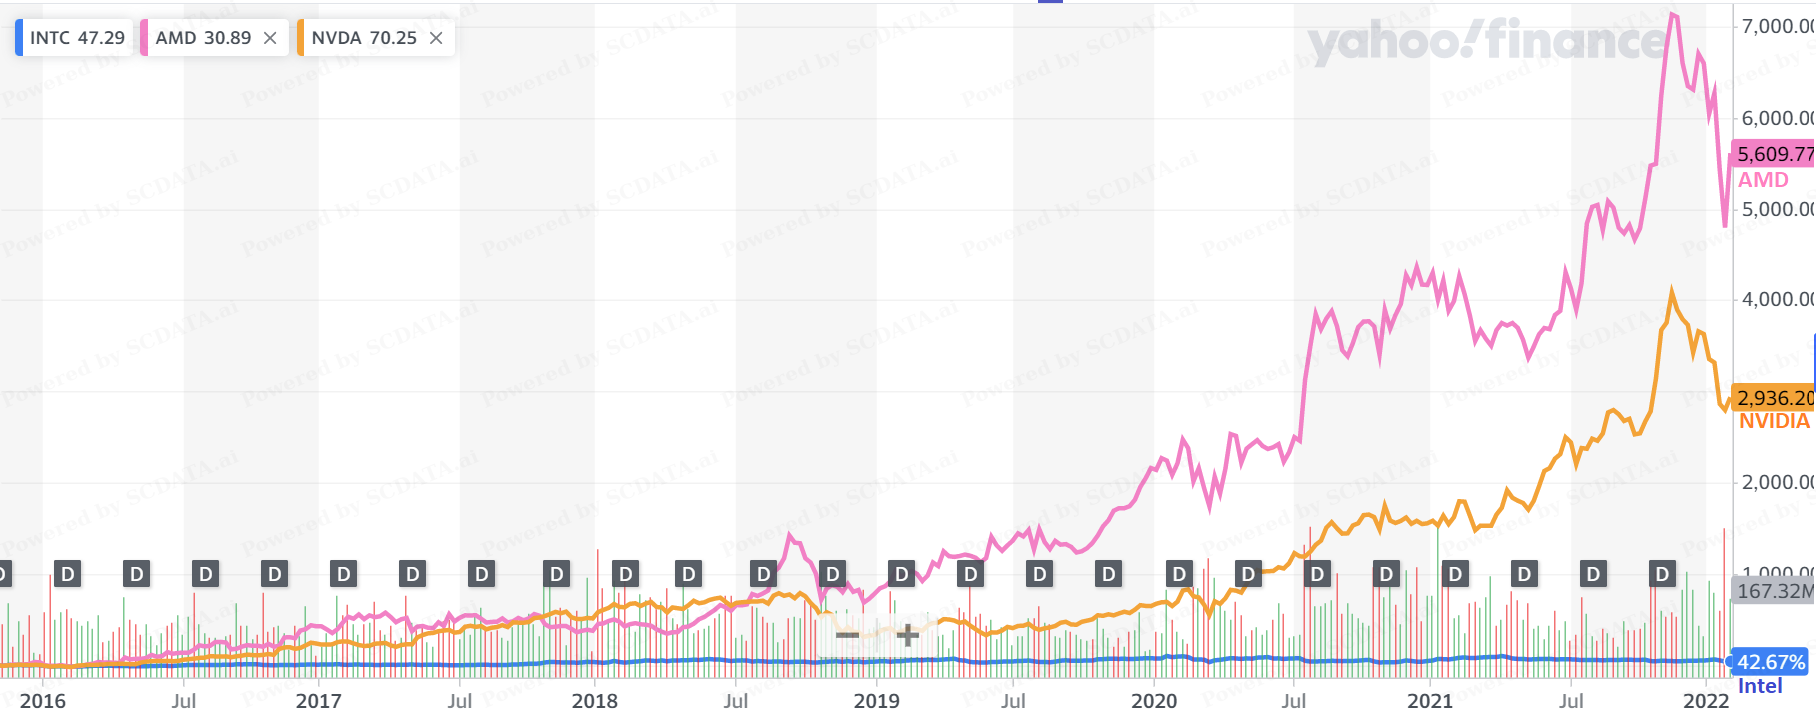
Enterprise Trend - Profitability

38
AMD has had an obvious overall increase in profitability over years. NVDA had increased until 2018. Intel climbed up a little but has been going down since 2018.
38/47
Enterprise Trend - Financial Health

39
AMD has improved its Liability Asset Ratio and Long Term Debt Ratio big time. Intel has been stable. NVDA's Current Ratio fluctuates.
39/47
Enterprise Trend - Efficiency

40
All have close Inventory Days. Intel has the lowest Cash Conversion Cycle and the highest Payable Days/Receivable Days. NVDA has the highest Cash Conversion Cycle and Labor Productivity.
40/47
Value Driver Analysis

42
A higher Liability Asset Ratio used to come with a lower Operating Margin. But it's not the trend in these recent years.
42/47
Value Driver Analysis

43
A higher Liability Asset Ratio may lead to a lower ROA.
43/47
Enterprise Breakdown - Revenue

44
Intel is slightly better than the industry. NVDA > industry in COGS
44/47
Enterprise Breakdown - Liability-Equity

45
AMD, Intel and NVDA all have above-average equity. Intel is relatively low than AMD or NVDA.
45/47
Enterprise Breakdown - Detailed Assets

46
AMD has a lot of cash. Intel is short on cash and has way more property plant & equipment than others (because Intel do both design & manufacturing while other US competitors focus on design.
46/47


