
4
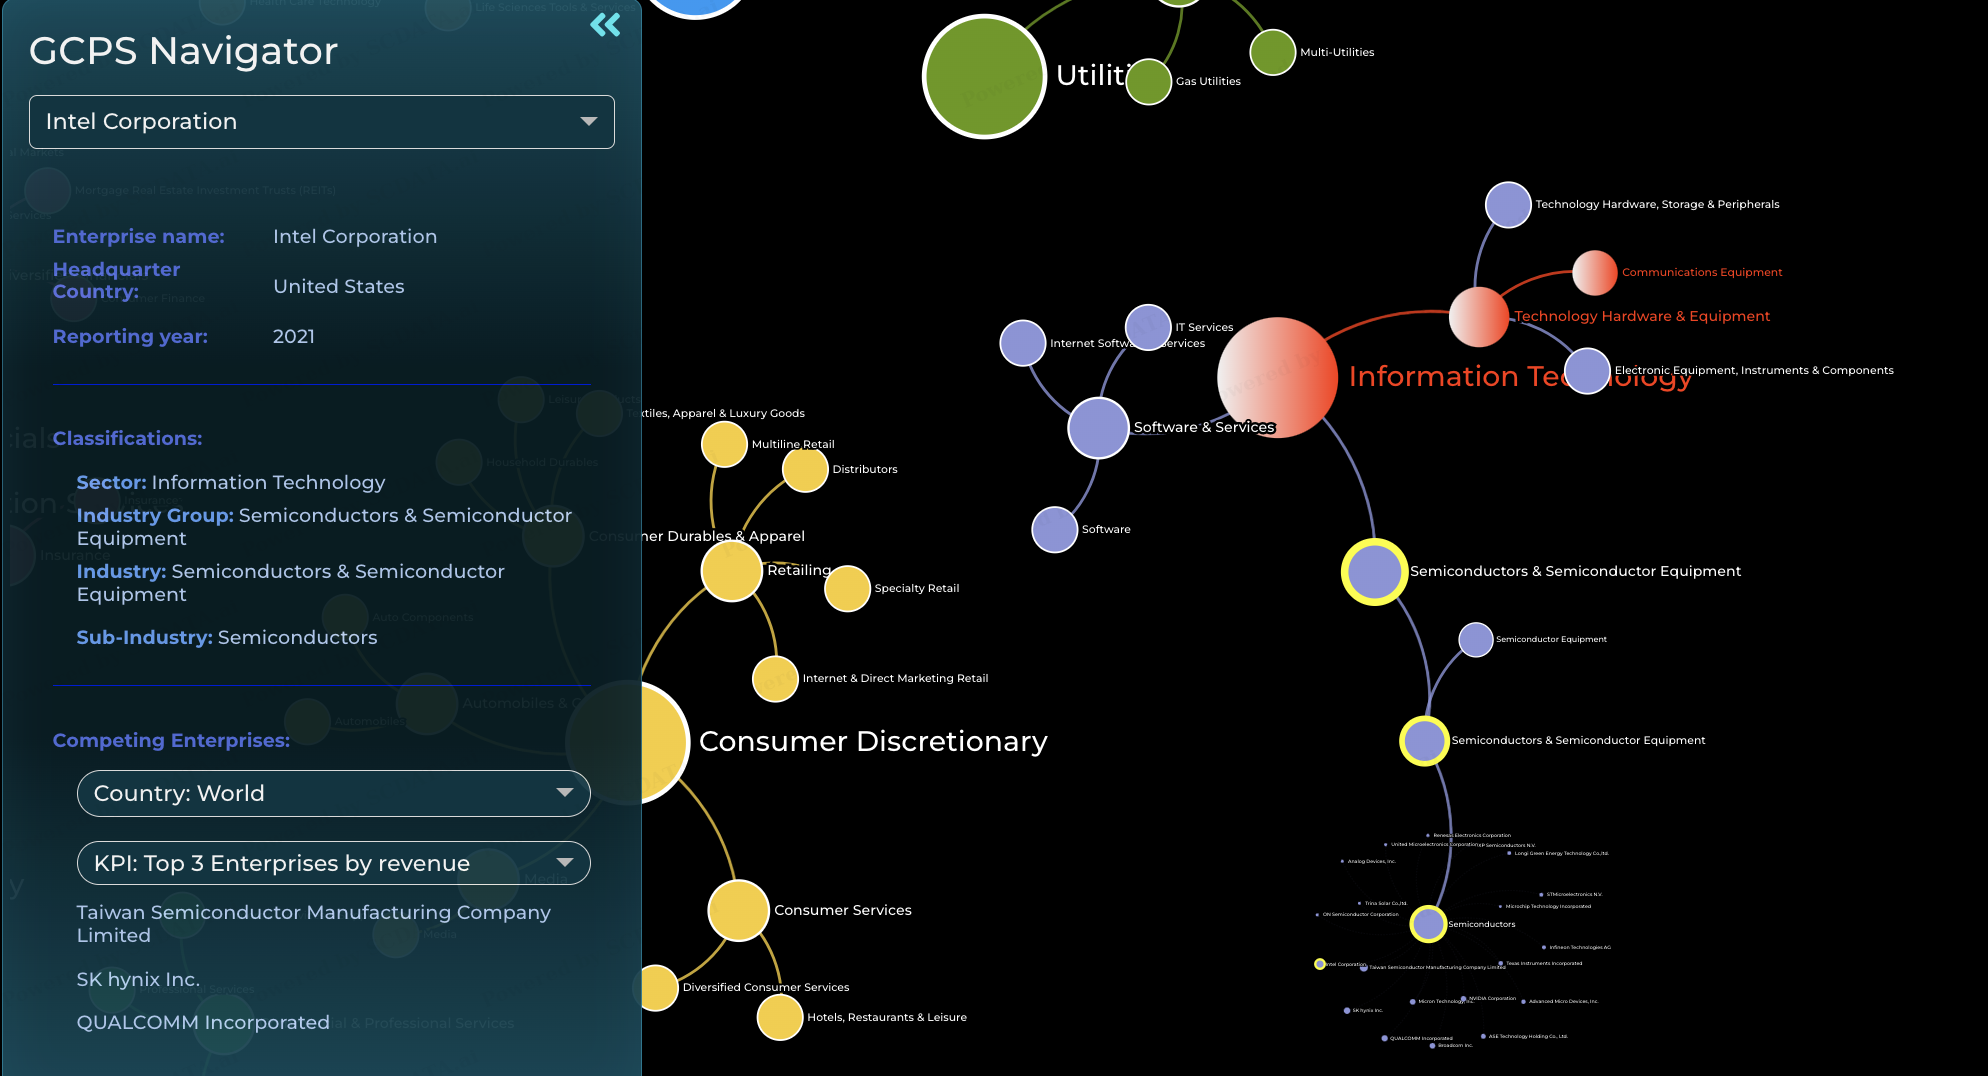
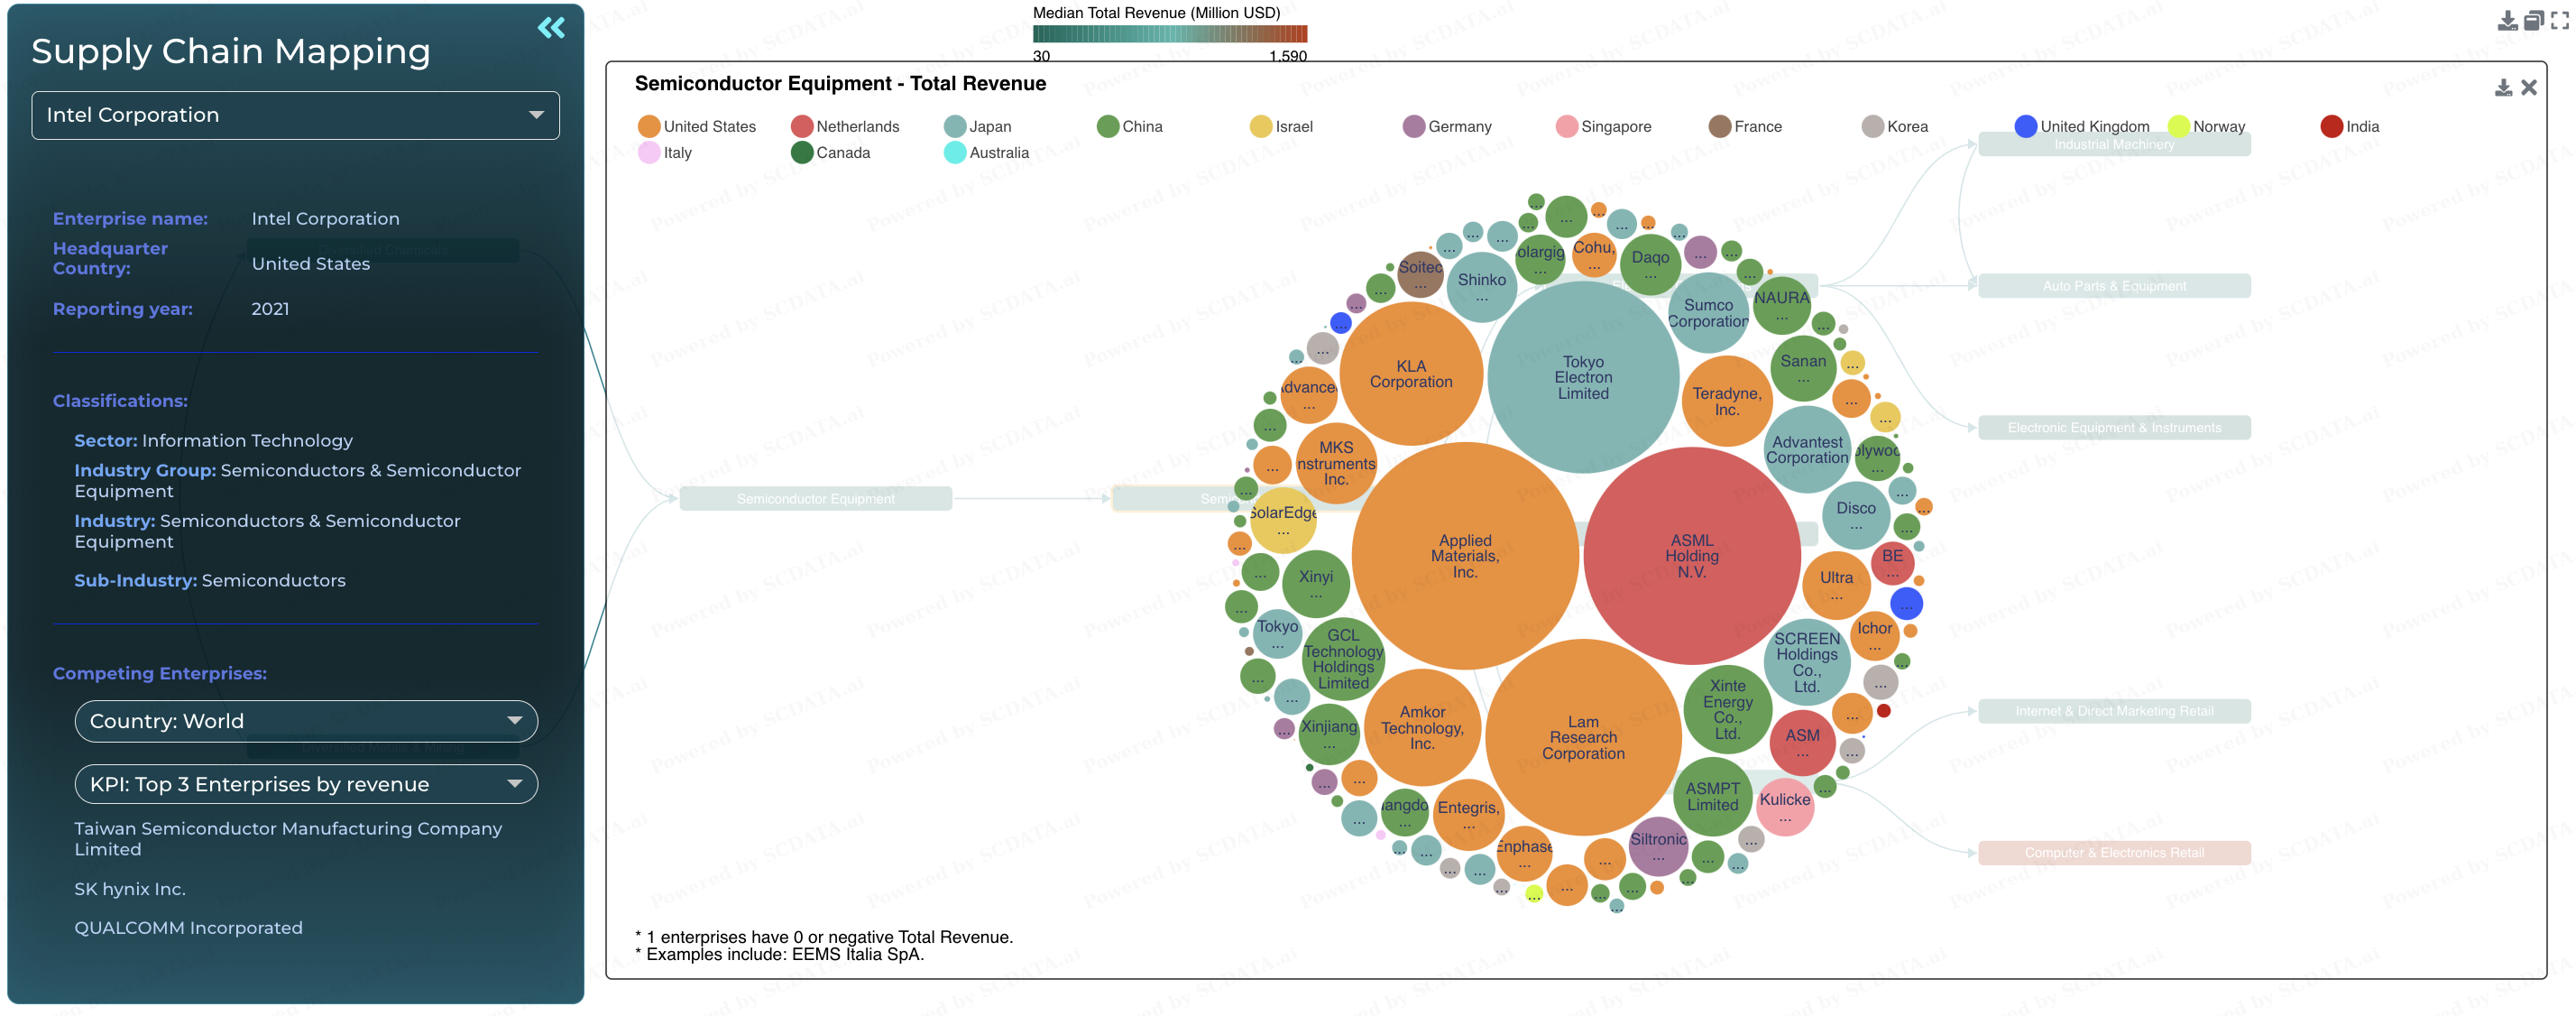
1. When Navigating Intel in the CCPS Navigator, we can learn about TSMC's industry classification: Information Technology --> Semiconductor & Semiconductor Equipment --> Semiconductor & Semiconductor Equipment --> Semiconductor.
2. Intel's top three competing Enterprises by revenue are TSMC, SK hynix, and QUACOMM
4/62

5
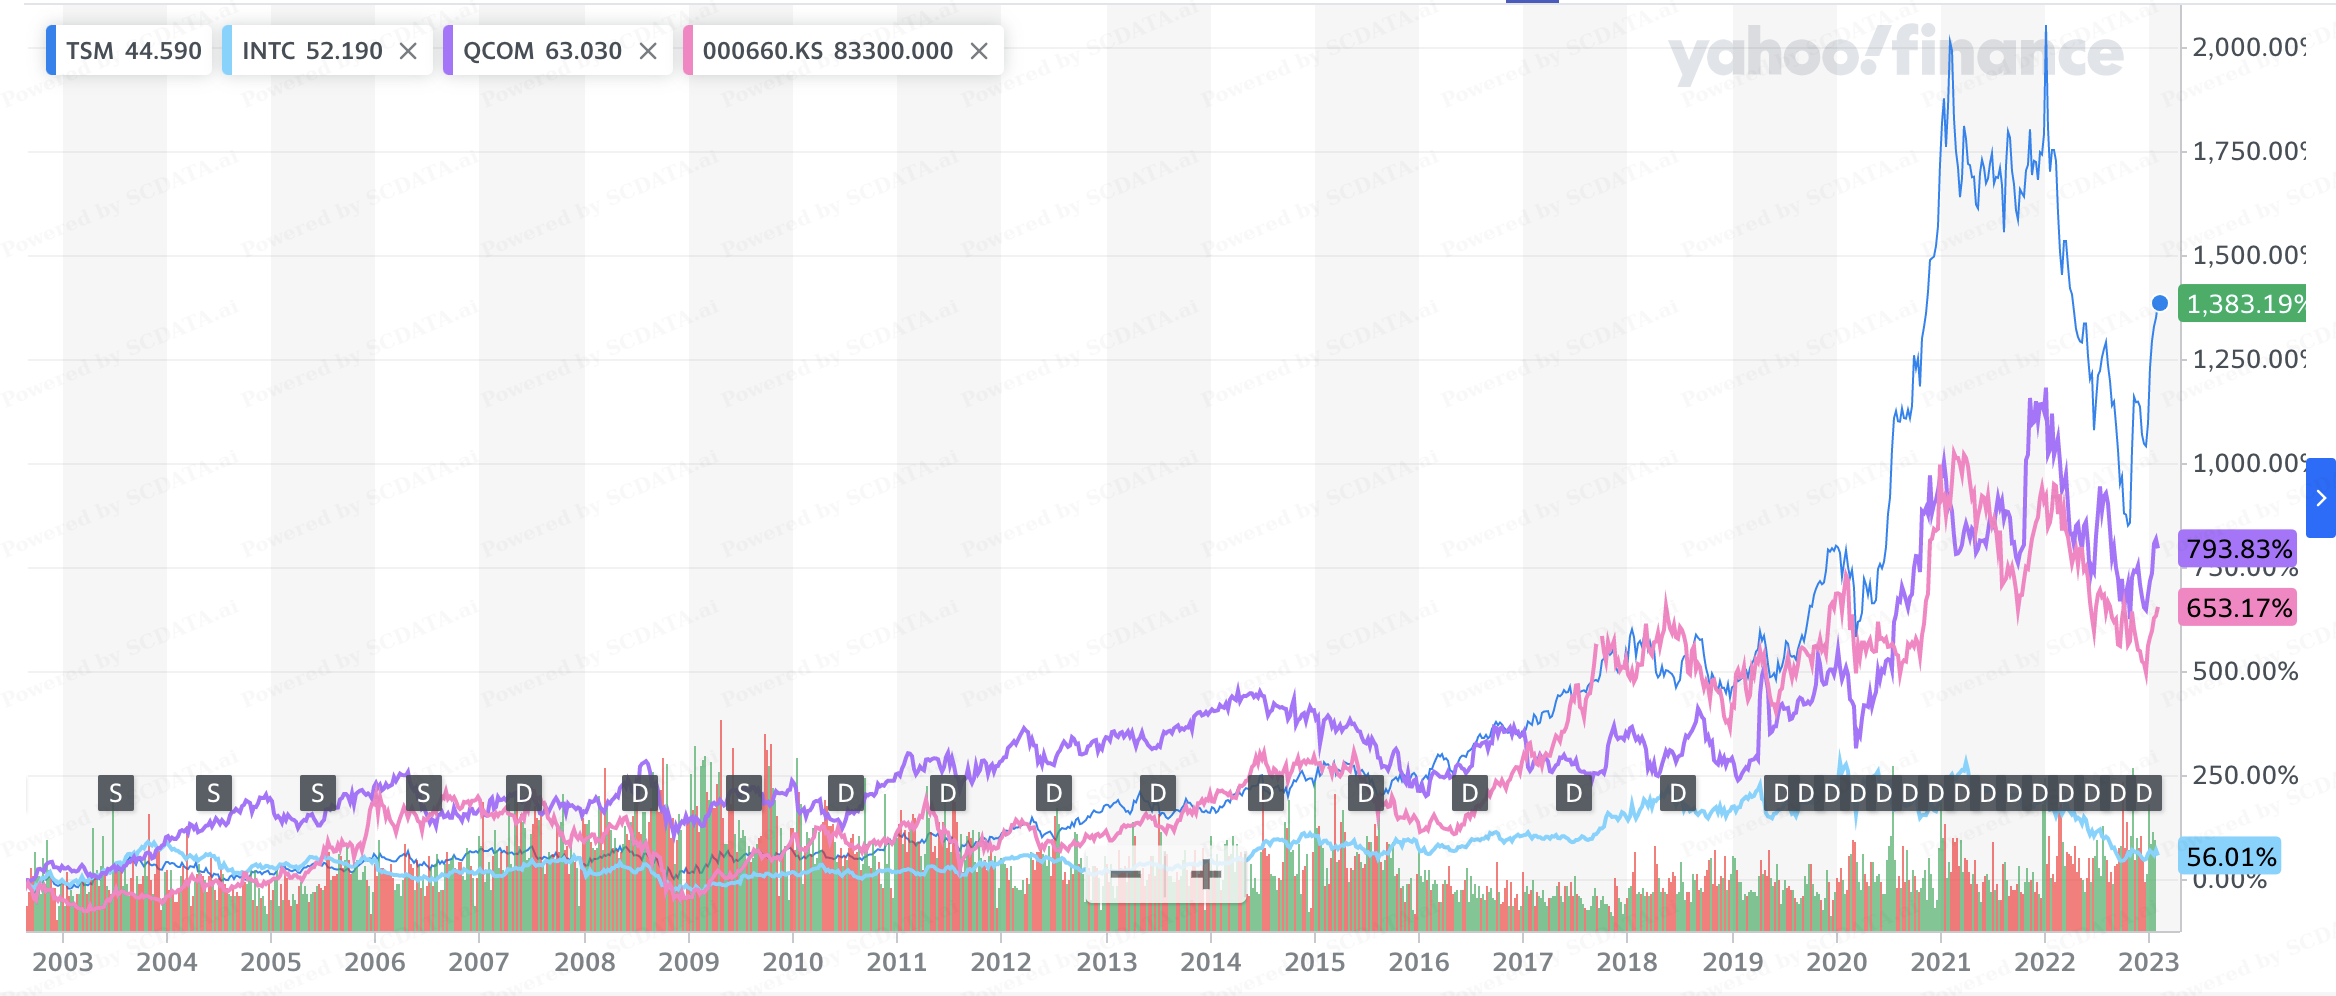
What I learned from this stock chart:
1. Semiconductor industry is a growing industry.
2. Intel's stock price does not perform as well as the other three.
5/62
Enterprise Distribution

7
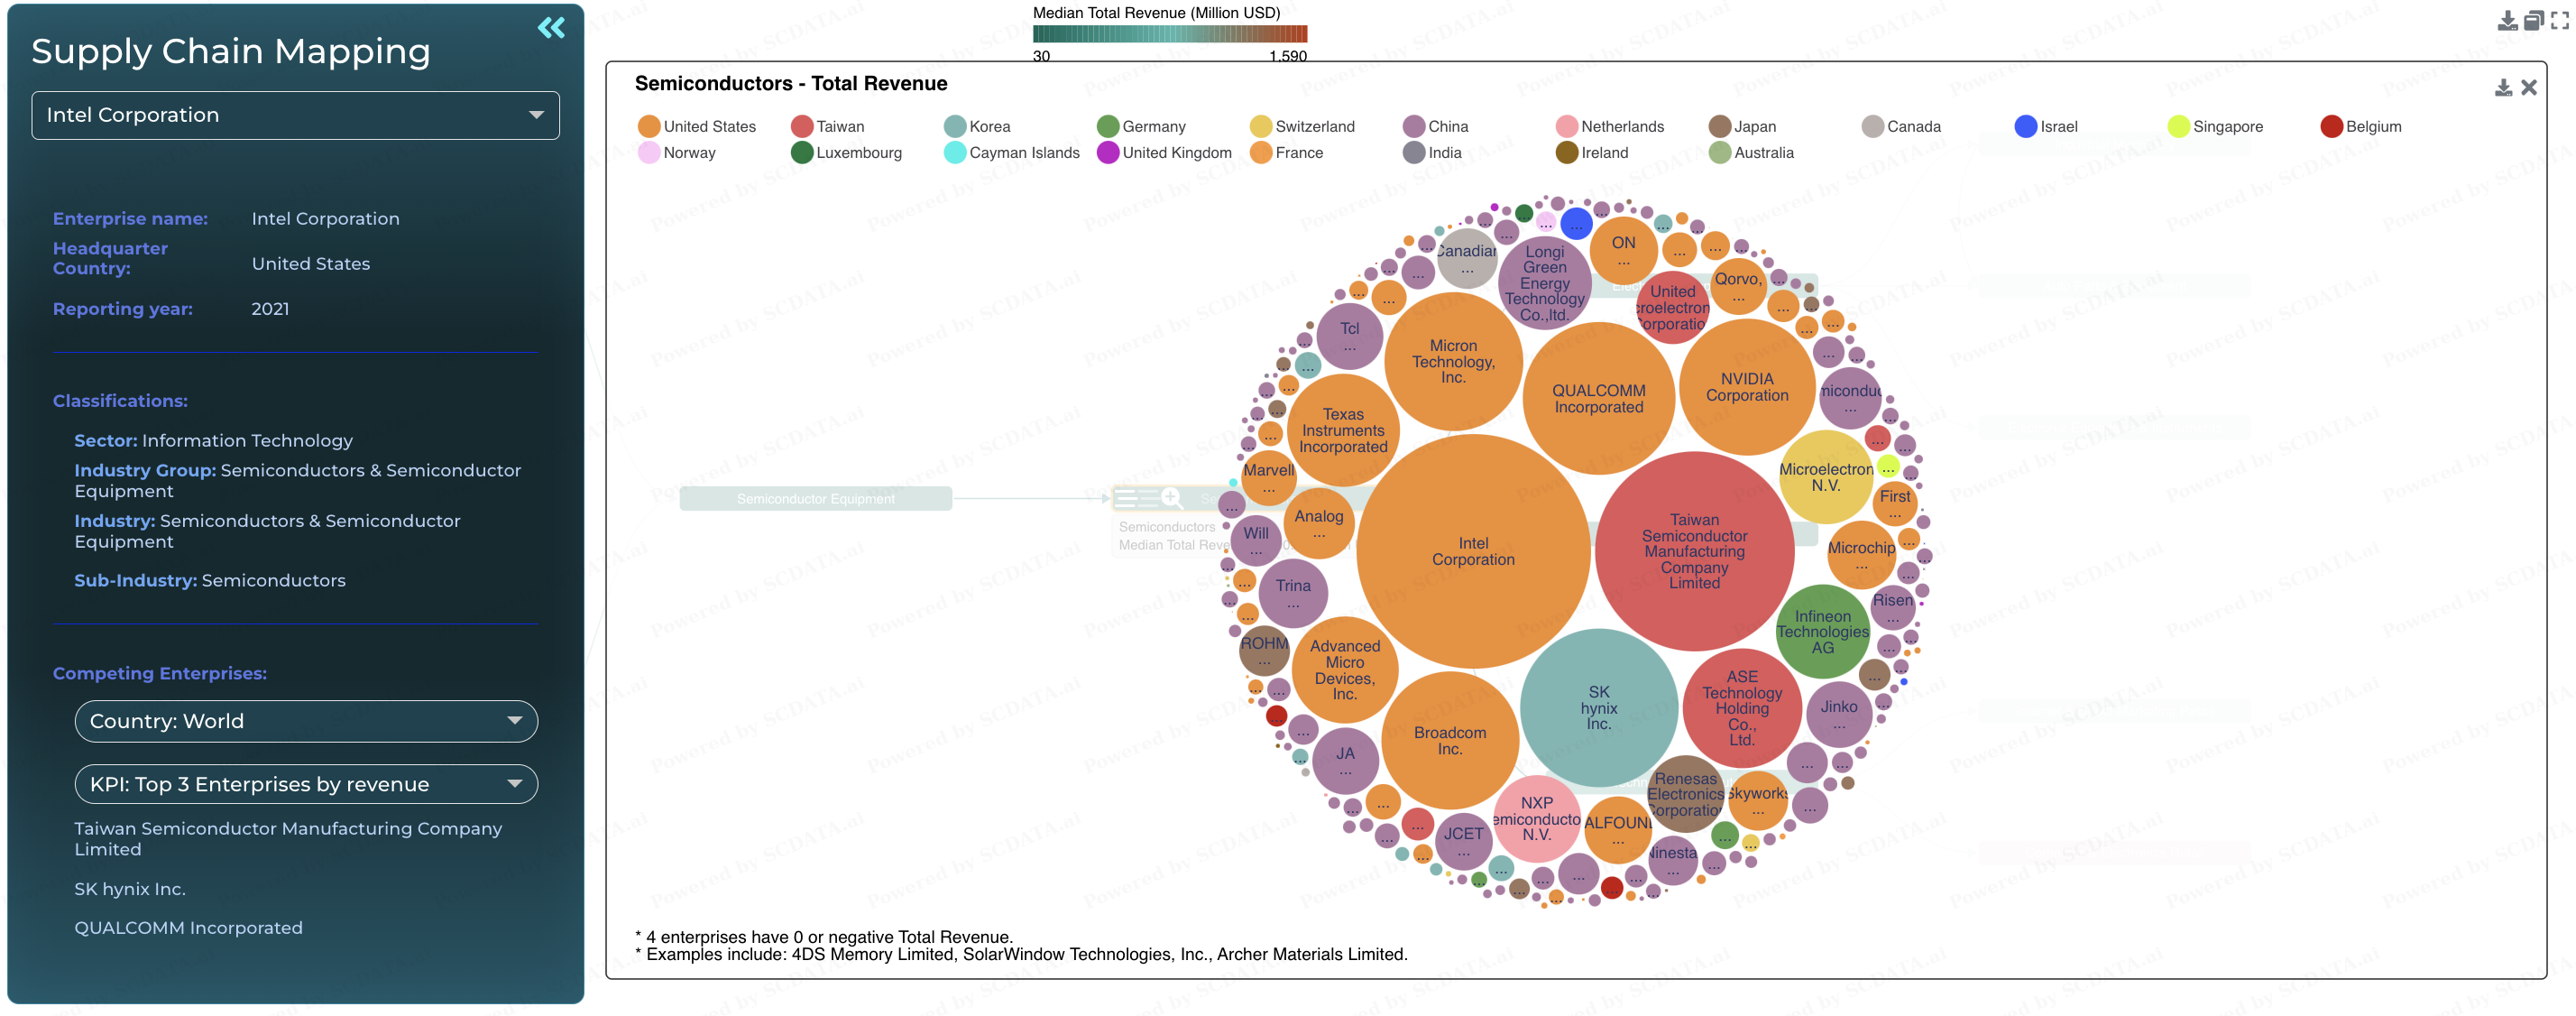
Most of the Semiconductor companies are in Asia, follow by North America.
7/62
Typical Firm Performance by Region - Profit Distribution

8
Some insights from the median revenue bar chart:
1. Netherlands (red) has the highest median revenue in the semiconductor industry.
2. Taiwan (orange), where TSMC's headquarters is, has the second highest median revenue.
3. The median revenue of US is slightly higher than China.
8/62
Concentration and Competition Intensity - Four-firm Concentration Ratio

9
1. The concentration ratios of semiconductor industry in Taiwan, Korea, and japan are extremely high, and follow by US, and China has the lowest concentration ratio.
2. China may have more opportunity and higher competition intensity than other countries.
9/62
Industrial Trend - Industry Total Size

11
- US has been outstanding in total revenue and operation income.
- There is an upward trend of revenue and income in every countries.
11/62
Industrial Trend - Profitability

12
The company performance has shown a growth trend in the past two to three years.
12/62
Industrial Trend - Growth

13
China's growth rate is high, which means the semiconductor industry in China is developing.
13/62
Industrial Trend - Financial Health

14
1. Current Ratio: China is improving, US has high current ration, Taiwan and Korea are relatively low.
2. Taiwan is significantly higher than other countries in "total cash flow form operating activities" and "cash and cash equivalents."
14/62
Industrial Trend - Efficiency

15
In 2021,
1. Inventory Days: China > US > Korea > Japan > Taiwan
2. Cash Conversion Cycle: China > US > Taiwan
3. Asset Turnover: Korea > Japan > Taiwan > China > US
4. Return in Assets: Taiwan > US > China > Japan > Korea
15/62
Industrial Comparison - Profitability

21
1. All the three main downstream industries have higher total revenue than the semiconductor industry.
2. Though transportation industry has the highest total revenue but its has the least median revenue, I think it is because there are too many companies in this category.
3. Despite of the relatively low total revenue, the semiconductor industry is doing well on the median operation margin, median net margin and proportion of profitable enterprises.
21/62
Industrial Comparison - Growth

22
1. Transportation industry has an extremely high growth rate, I am wondering if this is because of the pandemic.
2. So, leaving aside the transportation industry, the semiconductor industry has a high grow rates in median revenue, median operating income, and median net income.
22/62
Industrial Comparison - Financial Health

23
The semiconductor industry is performing well with high current ratio, low liability asset ratio, and high free cash flow to total cost ratio.
23/62
Industrial Comparison - Efficiency

24
1. Semiconductor industry and telecommunication services industry have higher labor productivity.
2. Telecommunication services industry is performing well with a high payable days to receivable days ratio.
3. Transportation has an extremely high inventory turnover, possibly because it mostly provides service with little inventory inhouse.
24/62
Revenue vs. Cost

26
First look at revenue vs cost, followings are my findings:
1. The slopes of the five countries are not much different.
2. US: (1) Intel has a super high revenue, at the same time, a very high cost. (2) Three are many middle size companies in the US.
26/62
Profit vs. Cost - Operating Income

27
The Operating Income vs Cost chart shows that Intel and TSMC had similar operating income in 2021 but the total cost of Intel was 56,942 Million, and only 33,893 Million for TSMC. And when comparing the middle-size companies in this chart, Texas Instruments performanced well with relatively low cost and high income. Also, the scale of the company in China, Japan and Korea were small compared to others.
27/62
Profit vs. Total Assets - Operating Income

28
Since there are few data points in Taiwan, I think Taiwan's regression line is not representative. So if just look at the to data points of Intel and TSMC, TSMC performed better because it used less asset and generated more income. Within the US semiconductor companies, NVIDA, QUALCOMM, Texas Instruments, and AMD were above the regression line, Broadcom and Micron were close to the line, and Analog Devices was below the line.
28/62
Operating Margin vs. Revenue

29
From the Operating Margin vs Revenue chart, it seemed that Texas Instruments, TSMC and Intel are on the profit frontier. Though Intel was on the profit frontier, its performance on operating margin was not as well as its competitors such as TSMC, QUALCOMM, NVIDA and Texas Instruments. Also, I think using profit frontier in this Intel example is not as effective as in the airline industry professor introduced as there is no other company with similar revenue level as Intel.
29/62
Return on Assets vs. Liability Asset Ratio

30
When compare Intel to its two main competitors, TSMC and QUALCOMM, the ROA vs Liability Asset Ratio chart shows:
1. ROA - Intel (0.118), QUALCOMM (0.21), TSMC (0.159): Intel had the lowest ROA within the three, which means Intel had less ability to make use of its assets for getting more profits.
2. Liability Asset Ratio - Intel (0.434), QUALCOMM (0.759), TSMC (0.422): QUALCOMM had a particularly high value, which indicates the shareholder equity is low and potential solvency issues.
30/62
Enterprise Ranking - Total Revenue

32
When looking into the rankings of company's revenue and net margin, though Intel had the highest revenue of the five countries (US, China, Japan, Korea, and Taiwan), it ranked 39 in the net margin, which implies that Intel might use an ineffective cost structure and/or poor pricing strategies.
32/62
Enterprise Ranking - Net Margin - 1

33
When looking into the rankings of company's revenue and net margin, though Intel had the highest revenue of the five countries (US, China, Japan, Korea, and Taiwan), it ranked 39 in the net margin, which implies that Intel might use an ineffective cost structure and/or poor pricing strategies.
33/62
Enterprise Ranking - Net Margin - 2

34
When looking into the rankings of company's revenue and net margin, though Intel had the highest revenue of the five countries (US, China, Japan, Korea, and Taiwan), it ranked 39 in the net margin, which implies that Intel might use an ineffective cost structure and/or poor pricing strategies.
34/62
KPI Examination - Intel (2021)

36
This is the KPI examination of Intel in the US market, followings are my findings:
1. Profitability: though this table shows that Intel had a high Operating Margin and Net Margin, when when compare these numbers to those of TSMC and QUALCOMM, Intel definitely has more space to improve and needs to make better use of its assets and invested capital.
2. Financial Health: Intel is average in terms of financial health.
(continue in next page...)
36/62
KPI Examination - TSMC (2021)

37
3. Growth: Intel's growth rate was lower than most of its peers. It may be because Intel's scale has become so large that it is difficult to grow significantly. Also, Intel needs to actively look for products, services, etc. that will allow the company to continue to grow.
4. Operational Efficiency: Intel had a normal Inventory Days and low Sales General Admin Cost / Total Revenue and CCC, which is better than the majority of the industry. However, TSMC and QUALCOMM performed even better on their Operational Efficiency KPIs, Intel might have to keep optimizing its supply chain to improve efficiency.
37/62
KPI Examination - QUALCOMM (2021)

38
What I want to highlight here is that QUALCOMM had a low Current Ratio and a high Liability Asset Ratio, means that it have a difficult time paying your immediate debts and liabilities and the shareholder equity is low and potential solvency issues.
38/62
Enterprise Comparison - Size

41
In the size comparison, Intel and TSCM outperformed the other three companies in 2021. Intel had the highest Total Revenue and Gross Profit, and TSMC had the highest Net Income, Operating Income, and Profit before Tax.
41/62
Enterprise Comparison - Profitability

42
When comparing the five companies' profitability, Intel's performance is mediocre. TSMC had the highest Operating Margin and Net Margin, Broadcom had the highest Gross Margin, and QUALCOMM had the highest ROA.
42/62
Enterprise Comparison - Return on Investment

43
QUALCOMM performed extraordinary on ROE, ROA, and Return on Invested Capital.
43/62
Enterprise Comparison - Efficiency

44
Most of the indexes here were discussed in the previous slides, the only thing I want to highlight here is that Intel had the highest Inventory Days among the five companies, which means that Intel might not able to quickly turn its inventory into sales, and this is a critical issue need to be solved.
44/62
Enterprise Trend - Size

45
The Total Revenue and Operating Income in Semiconductor Industry have been kept growing.
45/62
Enterprise Trend - Financial Health

46
Intel's (green) Current Ratio, Liability Asset Ratio, and Long Term Debt Ratio have been quite stable in these few years.
46/62
Enterprise Trend - Profitability

47
Intel's (green) Gross Margin, Operating Margin, Net Margin, and ROA have been quite stable in these few years too.
47/62
Enterprise Trend - Efficiency

48
We can see here that the Inventory Days, Labor Productivity, and Payable Days / Receivable Days in the Semiconductor Industry have an upward trend, and CCC has a downward trend.
We can learn that: (1) There have been some inventory issues in the overall industry (2) Enterprises' ability to collect money has improved. (3) The ability of industrial talents has been improved.
48/62
Value Driver Analysis - US SP 500 Focus: ROA vs Liability Asset Ratio

50
With low R square values, there is a weak correlation between ROA and Liability Asset Ratio in the Semiconductor Industry in the US.
50/62
Value Driver Analysis - US SP 500 Focus: Operating Margin vs Liability Asset Ratio

51
With low R square values, there is a weak correlation between Operating Margin and Liability Asset Ratio in the Semiconductor Industry in the US.
51/62
Enterprise Breakdown - Revenue (2019 Pre-COVID)

53
The Revenue Breakdown of the semiconductor industry from 2019 (Pre-COVID) to 2021(Post-COVID) has not changed much.
1. TSMC had higher COGS, followed by Intel, and QUALCOMM has the lowest.
2. TSMC had lower SG&A and R&D
3. QUALCOMM had a high Income Tax Expense in 2019 and return to normal in 2020 and 2021.
I don't think it's clear from these tables why Intel's share price is lagging the other two.
53/62
Enterprise Breakdown - Revenue (2020 During COVID)

54
The Revenue Breakdown of the semiconductor industry from 2019 (Pre-COVID) to 2021(Post-COVID) has not changed much.
1. TSMC had higher COGS, followed by Intel, and QUALCOMM has the lowest.
2. TSMC had lower SG&A and R&D
3. QUALCOMM had a high Income Tax Expense in 2019 and return to normal in 2020 and 2021.
I don't think it's clear from these tables why Intel's share price is lagging the other two.
54/62
Enterprise Breakdown - Revenue (2021 Post-COVID)

55
The Revenue Breakdown of the semiconductor industry from 2019 (Pre-COVID) to 2021(Post-COVID) has not changed much.
1. TSMC had higher COGS, followed by Intel, and QUALCOMM has the lowest.
2. TSMC had lower SG&A and R&D
3. QUALCOMM had a high Income Tax Expense in 2019 and return to normal in 2020 and 2021.
I don't think it's clear from these tables why Intel's share price is lagging the other two.
55/62
Enterprise Breakdown - Detailed Assets (2019 Pre-COVID)

56
The Assets Breakdown of the semiconductor industry from 2019 (Pre-COVID) to 2021 (Post-COVID) has not changed much.
1. QUALCOMM had little Short Term Investments in 2021, but it increased in 2020 and 2021.
2. The three companies asset investment on PPE is very different: Intel (40.57), QUALCOMM (9.35), TSMC(60.48).
***3. Compared to others, Intel had very little Cash and Cash Equivalents, which means that it would be harder for Intel to convert its asset to cash immediately.
4. Intel had the highest Inventory in 2019, and improved in 2020 and 2021
56/62
Enterprise Breakdown - Detailed Assets (2020 During COVID)

57
The Assets Breakdown of the semiconductor industry from 2019 (Pre-COVID) to 2021 (Post-COVID) has not changed much.
1. QUALCOMM had little Short Term Investments in 2021, but it increased in 2020 and 2021.
2. The three companies asset investment on PPE is very different: Intel (40.57), QUALCOMM (9.35), TSMC(60.48).
***3. Compared to others, Intel had very little Cash and Cash Equivalents, which means that it would be harder for Intel to convert its asset to cash immediately.
4. Intel had the highest Inventory in 2019, and improved in 2020 and 2021
57/62
Enterprise Breakdown - Detailed Assets (2021 Post-COVID)

58
The Assets Breakdown of the semiconductor industry from 2019 (Pre-COVID) to 2021 (Post-COVID) has not changed much.
1. QUALCOMM had little Short Term Investments in 2021, but it increased in 2020 and 2021.
2. The three companies asset investment on PPE is very different: Intel (40.57), QUALCOMM (9.35), TSMC(60.48).
***3. Compared to others, Intel had very little Cash and Cash Equivalents, which means that it would be harder for Intel to convert its asset to cash immediately.
4. Intel had the highest Inventory in 2019, and improved in 2020 and 2021
58/62


