Competitive Intelligence and Benchmarking
Nordstorm and the Multi Line Retail Industry
Chirag Jain
Netid: cj472
Week- 4&5 Homework
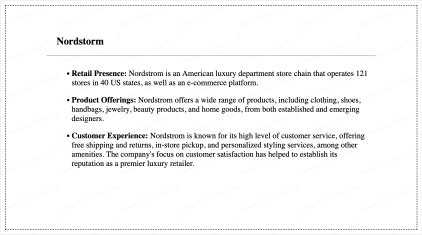
Nordstorm
Product Offerings: Nordstrom offers a wide range of products, including clothing, shoes, handbags, jewelry, beauty products, and home goods, from both established and emerging designers.
Customer Experience: Nordstrom is known for its high level of customer service, offering free shipping and returns, in-store pickup, and personalized styling services, among other amenities. The company's focus on customer satisfaction has helped to establish its reputation as a premier luxury retailer.
5 Year comparison of Norstorm (JWN) stock price change with its competitors and S&P 500
Legend:
Nordstorm: JWN (-52.81% Decline), Dillard's Inc: DDS (+ 304.72% Increase), Target Corporation: TGT (+ 205.18% Increase), Macy's: M (- 28.51% Decline), Kohls : KSS (+ 20.92% Increase), S&P 500 : GSPC (+101.69% Increase
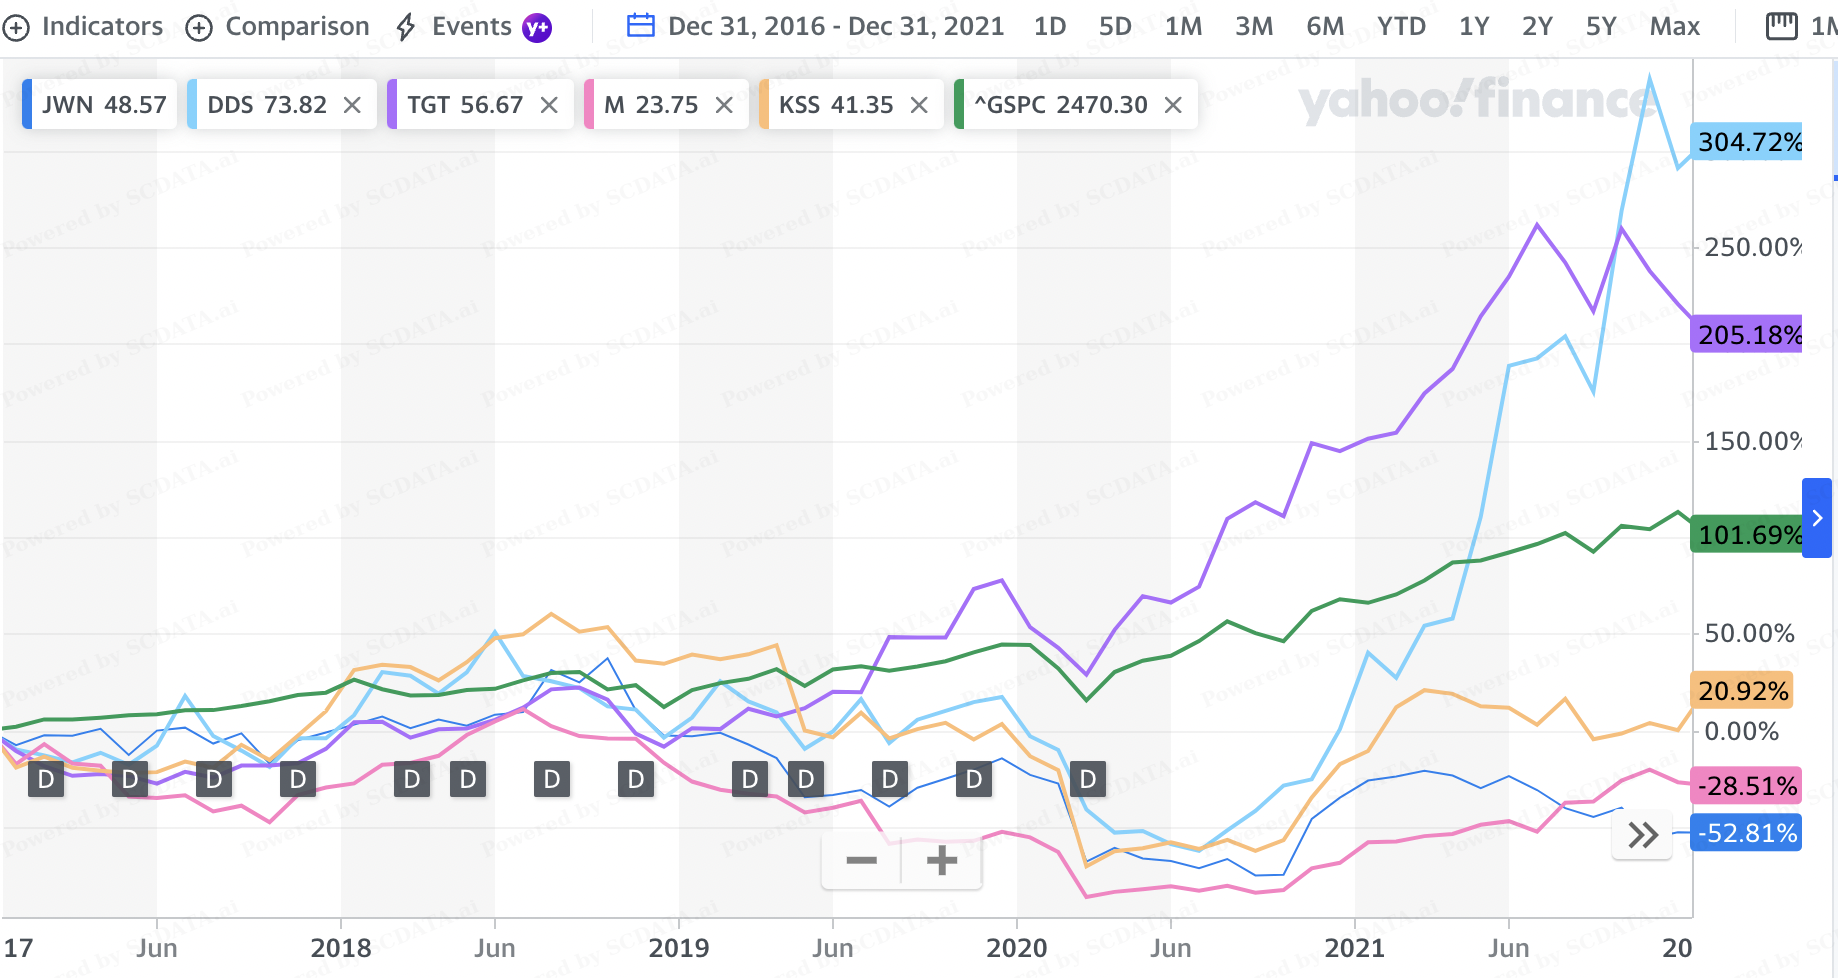
1. It is interesting to note that only Macy's and Nordstorm have a decline in their stock price change, when we compare data from 2016-2021, where Nordstorm being the lowest.
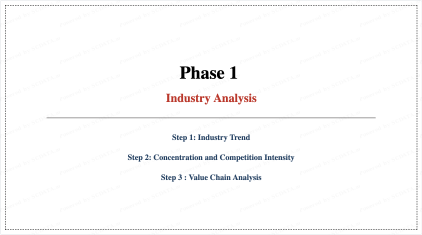
Phase 1
Industry Analysis
Step 1: Industry Trend
Step 2: Concentration and Competition Intensity
Step 3 : Value Chain Analysis
Step 1 - Industry Trend Analysis
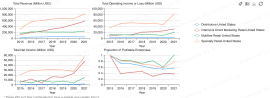
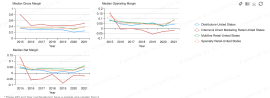
Industry Trend Analysis of Size for four sub industry in the Retail Category.
Industry Trend Analysis of Profitability for four sub industry in the Retail Category.
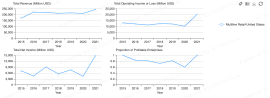
Industry Trend Analysis of Size for Multiline sub industry in the Retail Category.
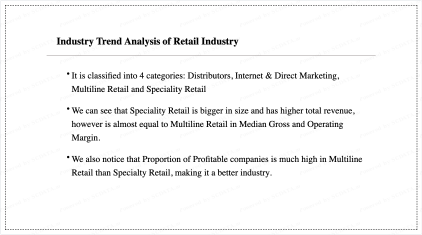
Industry Trend Analysis of Retail Industry
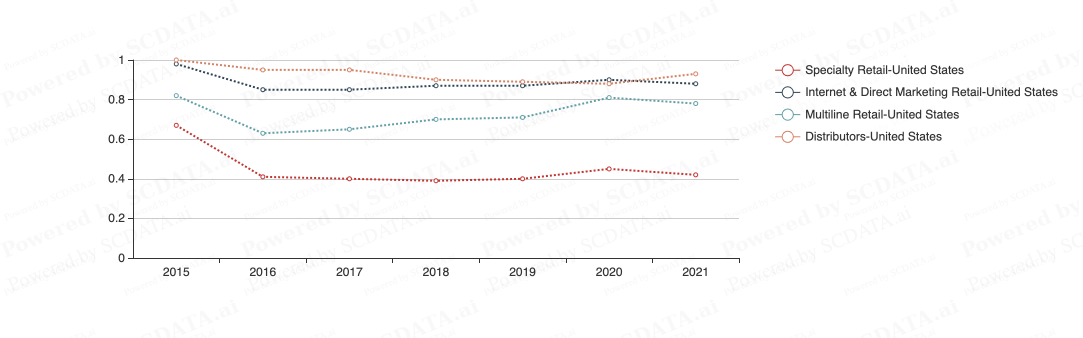
It is classified into 4 categories: Distributors, Internet & Direct Marketing, Multiline Retail and Speciality Retail
We can see that Speciality Retail is bigger in size and has higher total revenue, however is almost equal to Multiline Retail in Median Gross and Operating Margin.
We also notice that Proportion of Profitable companies is much high in Multiline Retail than Specialty Retail, making it a better industry.
Step 2 - Concentration and Competition Intensity
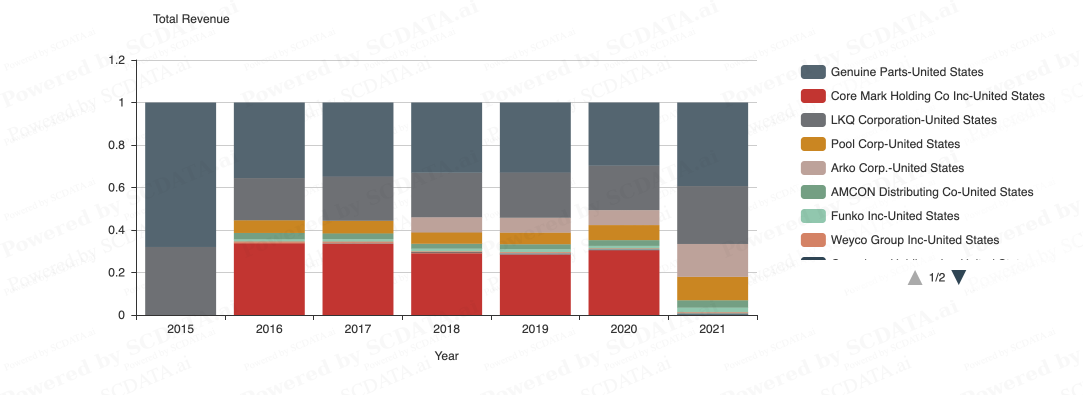
Market Share Analysis by Total Revenue for each industry.
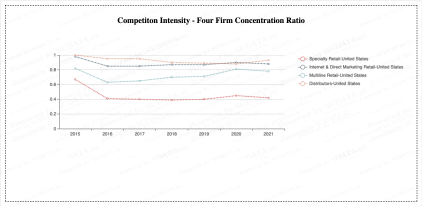
Competition Intensity - Four Firm Concentration Ratio
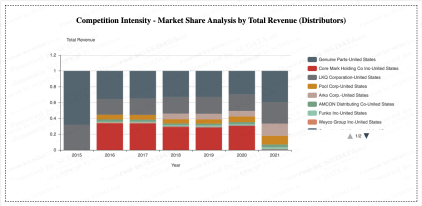
Competition Intensity - Market Share Analysis by Total Revenue (Distributors)
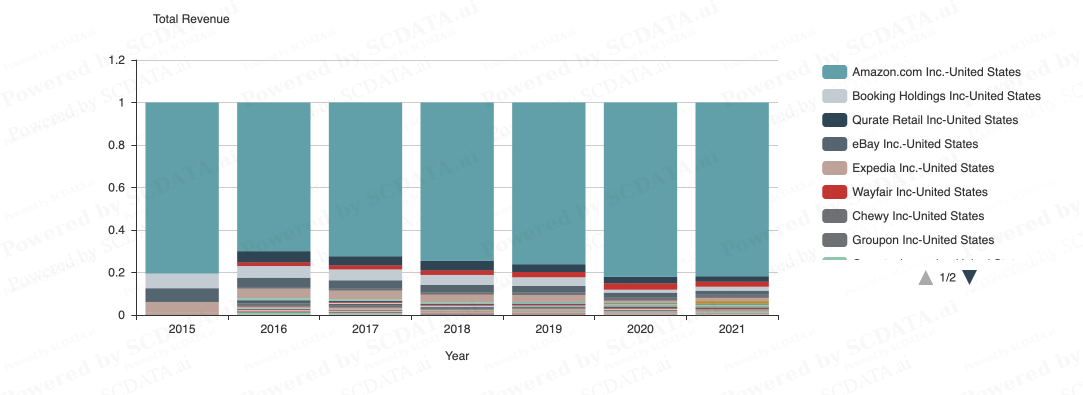
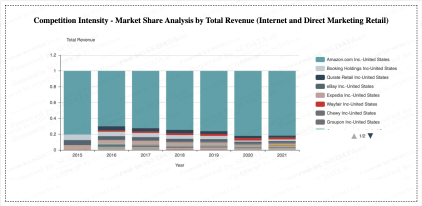
Competition Intensity - Market Share Analysis by Total Revenue (Internet and Direct Marketing Retail)
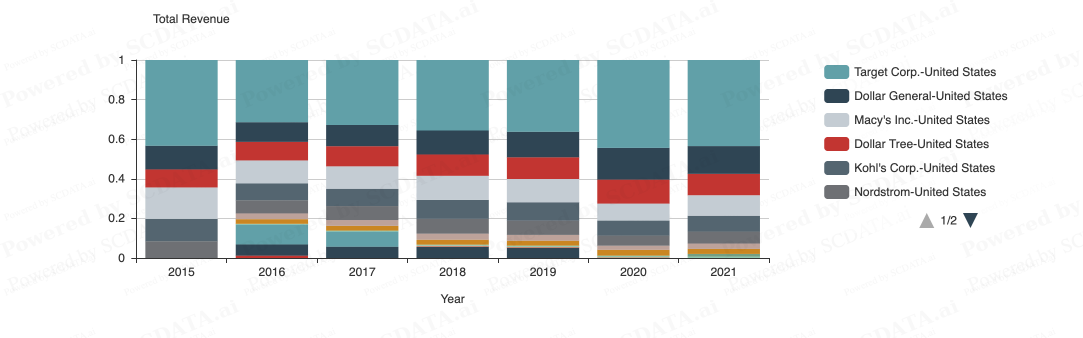
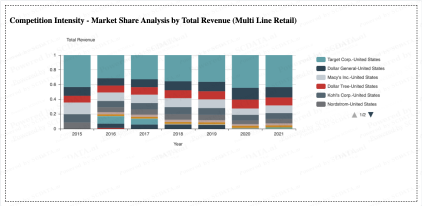
Competition Intensity - Market Share Analysis by Total Revenue (Multi Line Retail)
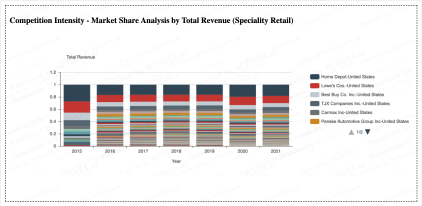
Competition Intensity - Market Share Analysis by Total Revenue (Speciality Retail)
Competiton Intensity - Four Firm Concentration Ratio
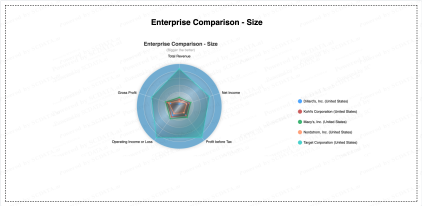
Enterprise Comparison - Size

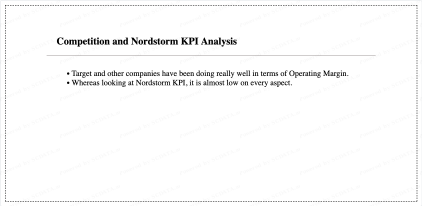
Competition and Nordstorm KPI Analysis
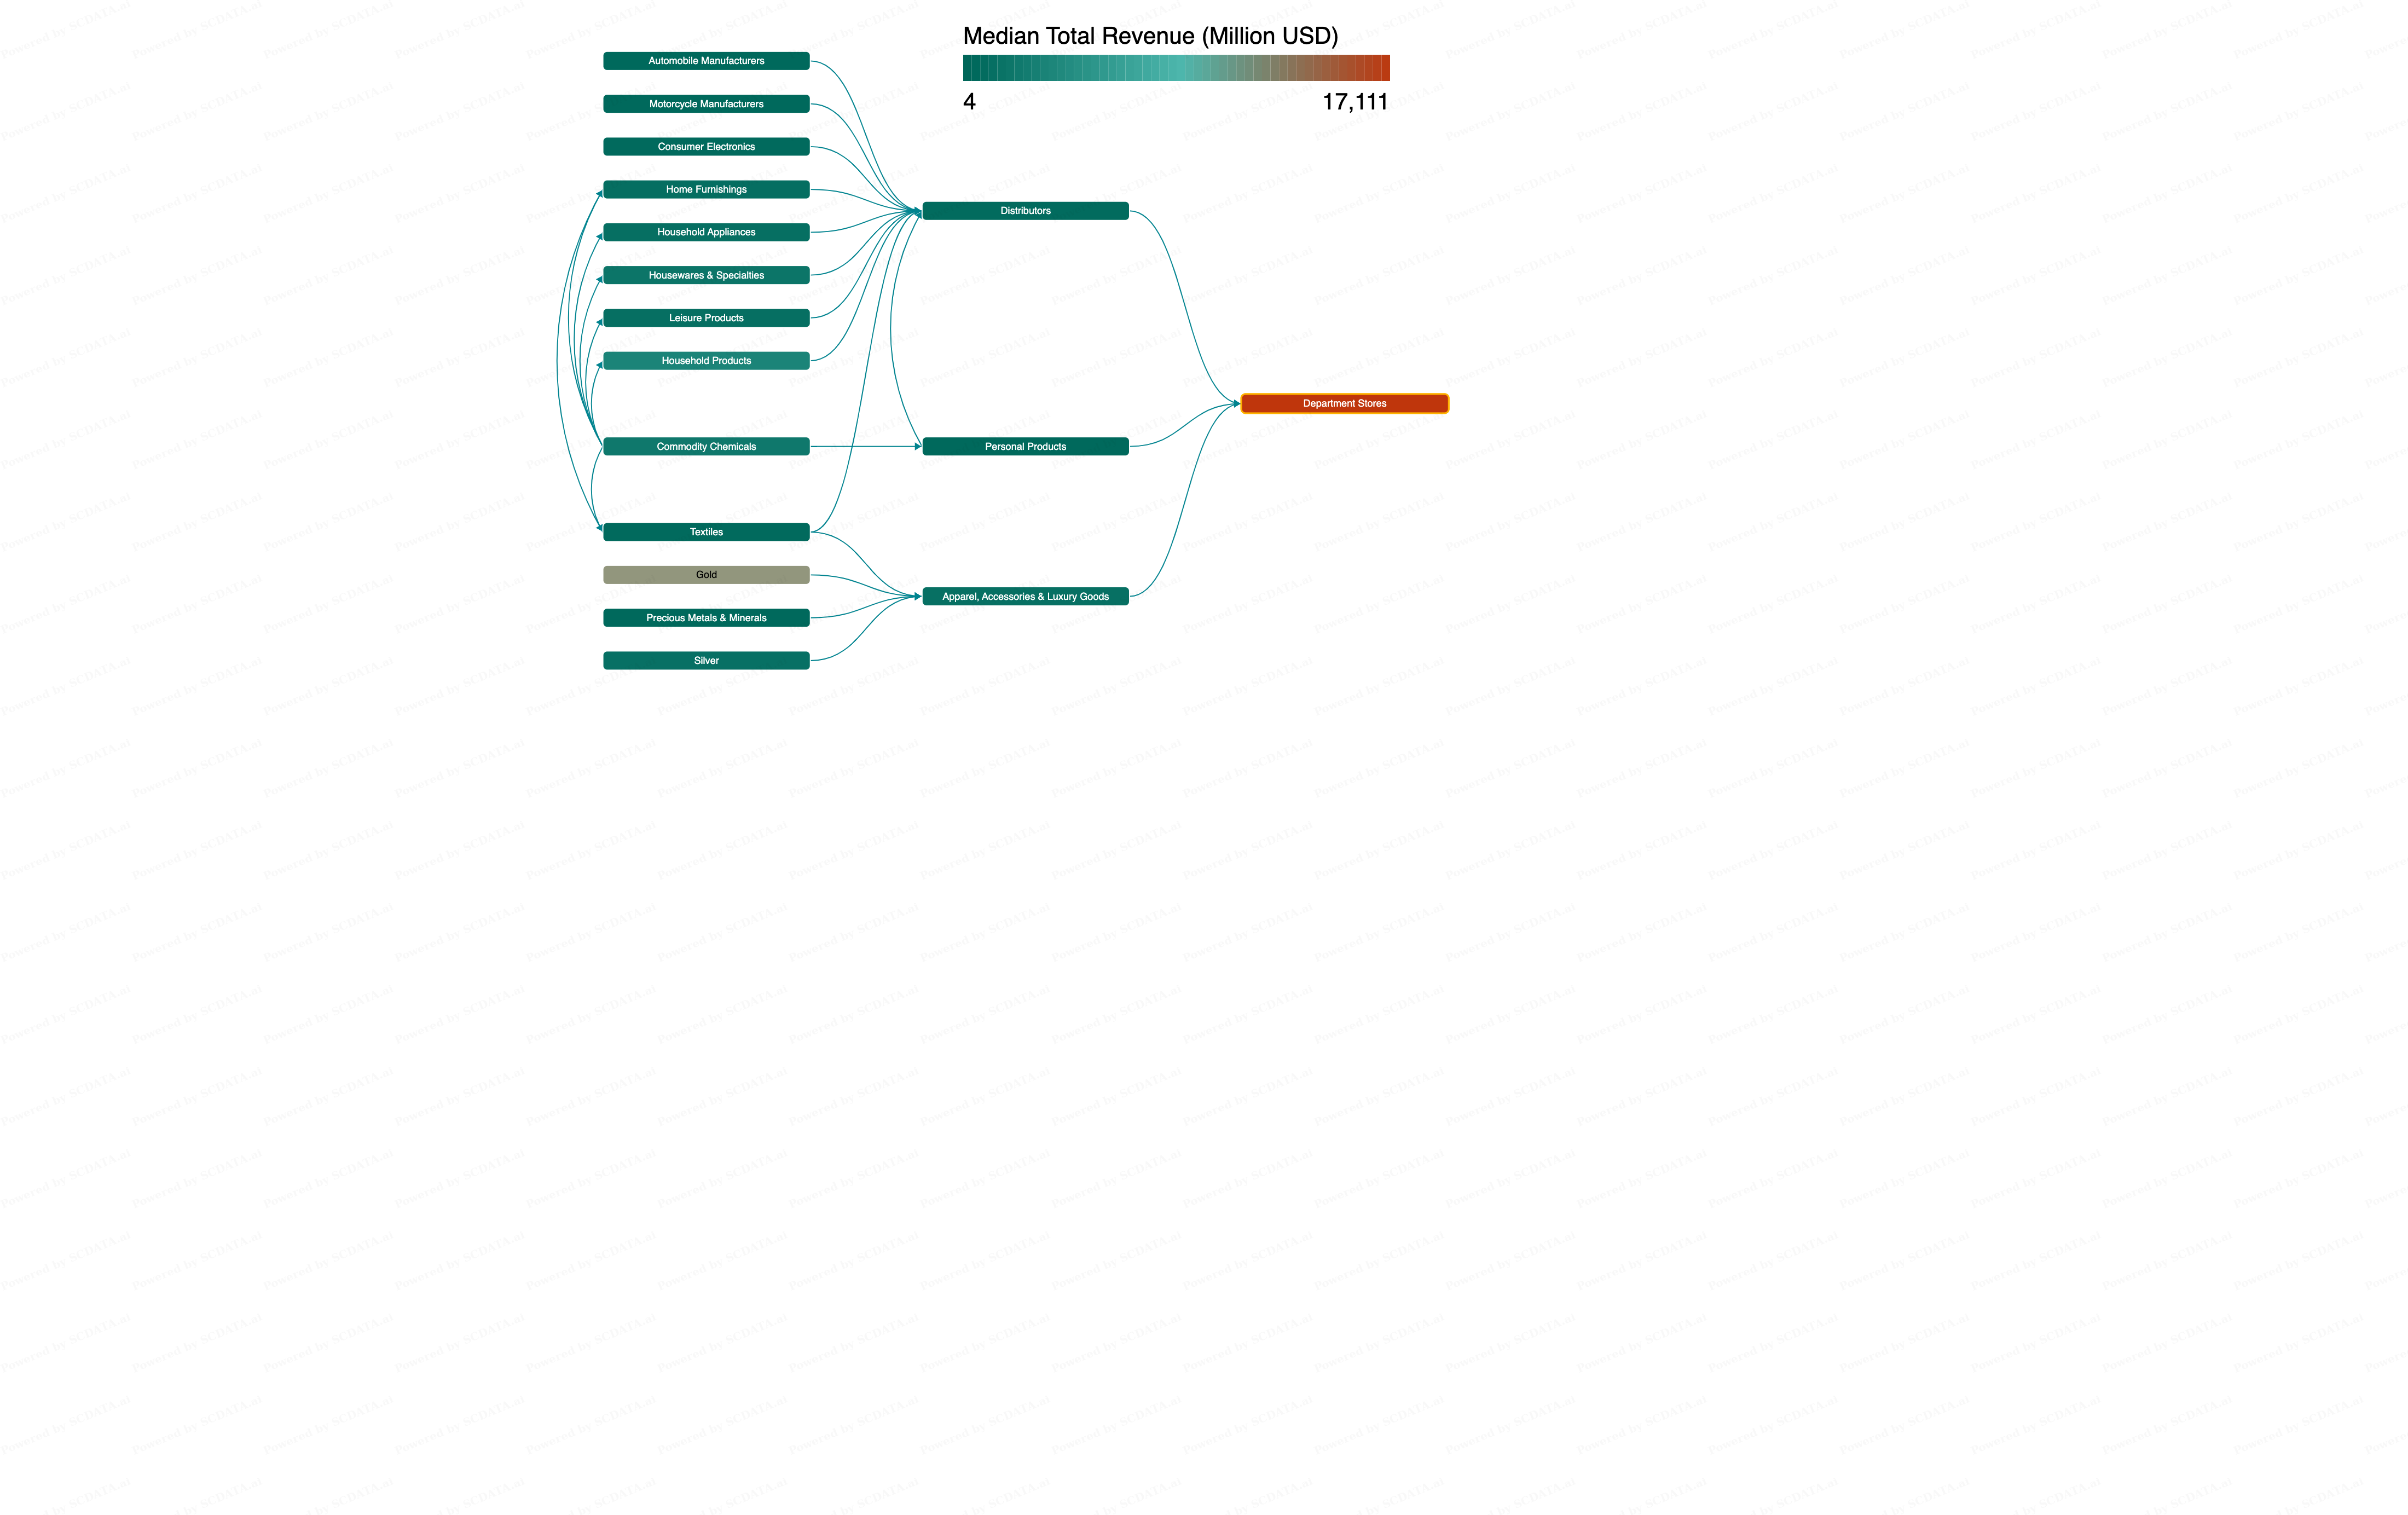
Step 3 - Value Chain Analysis
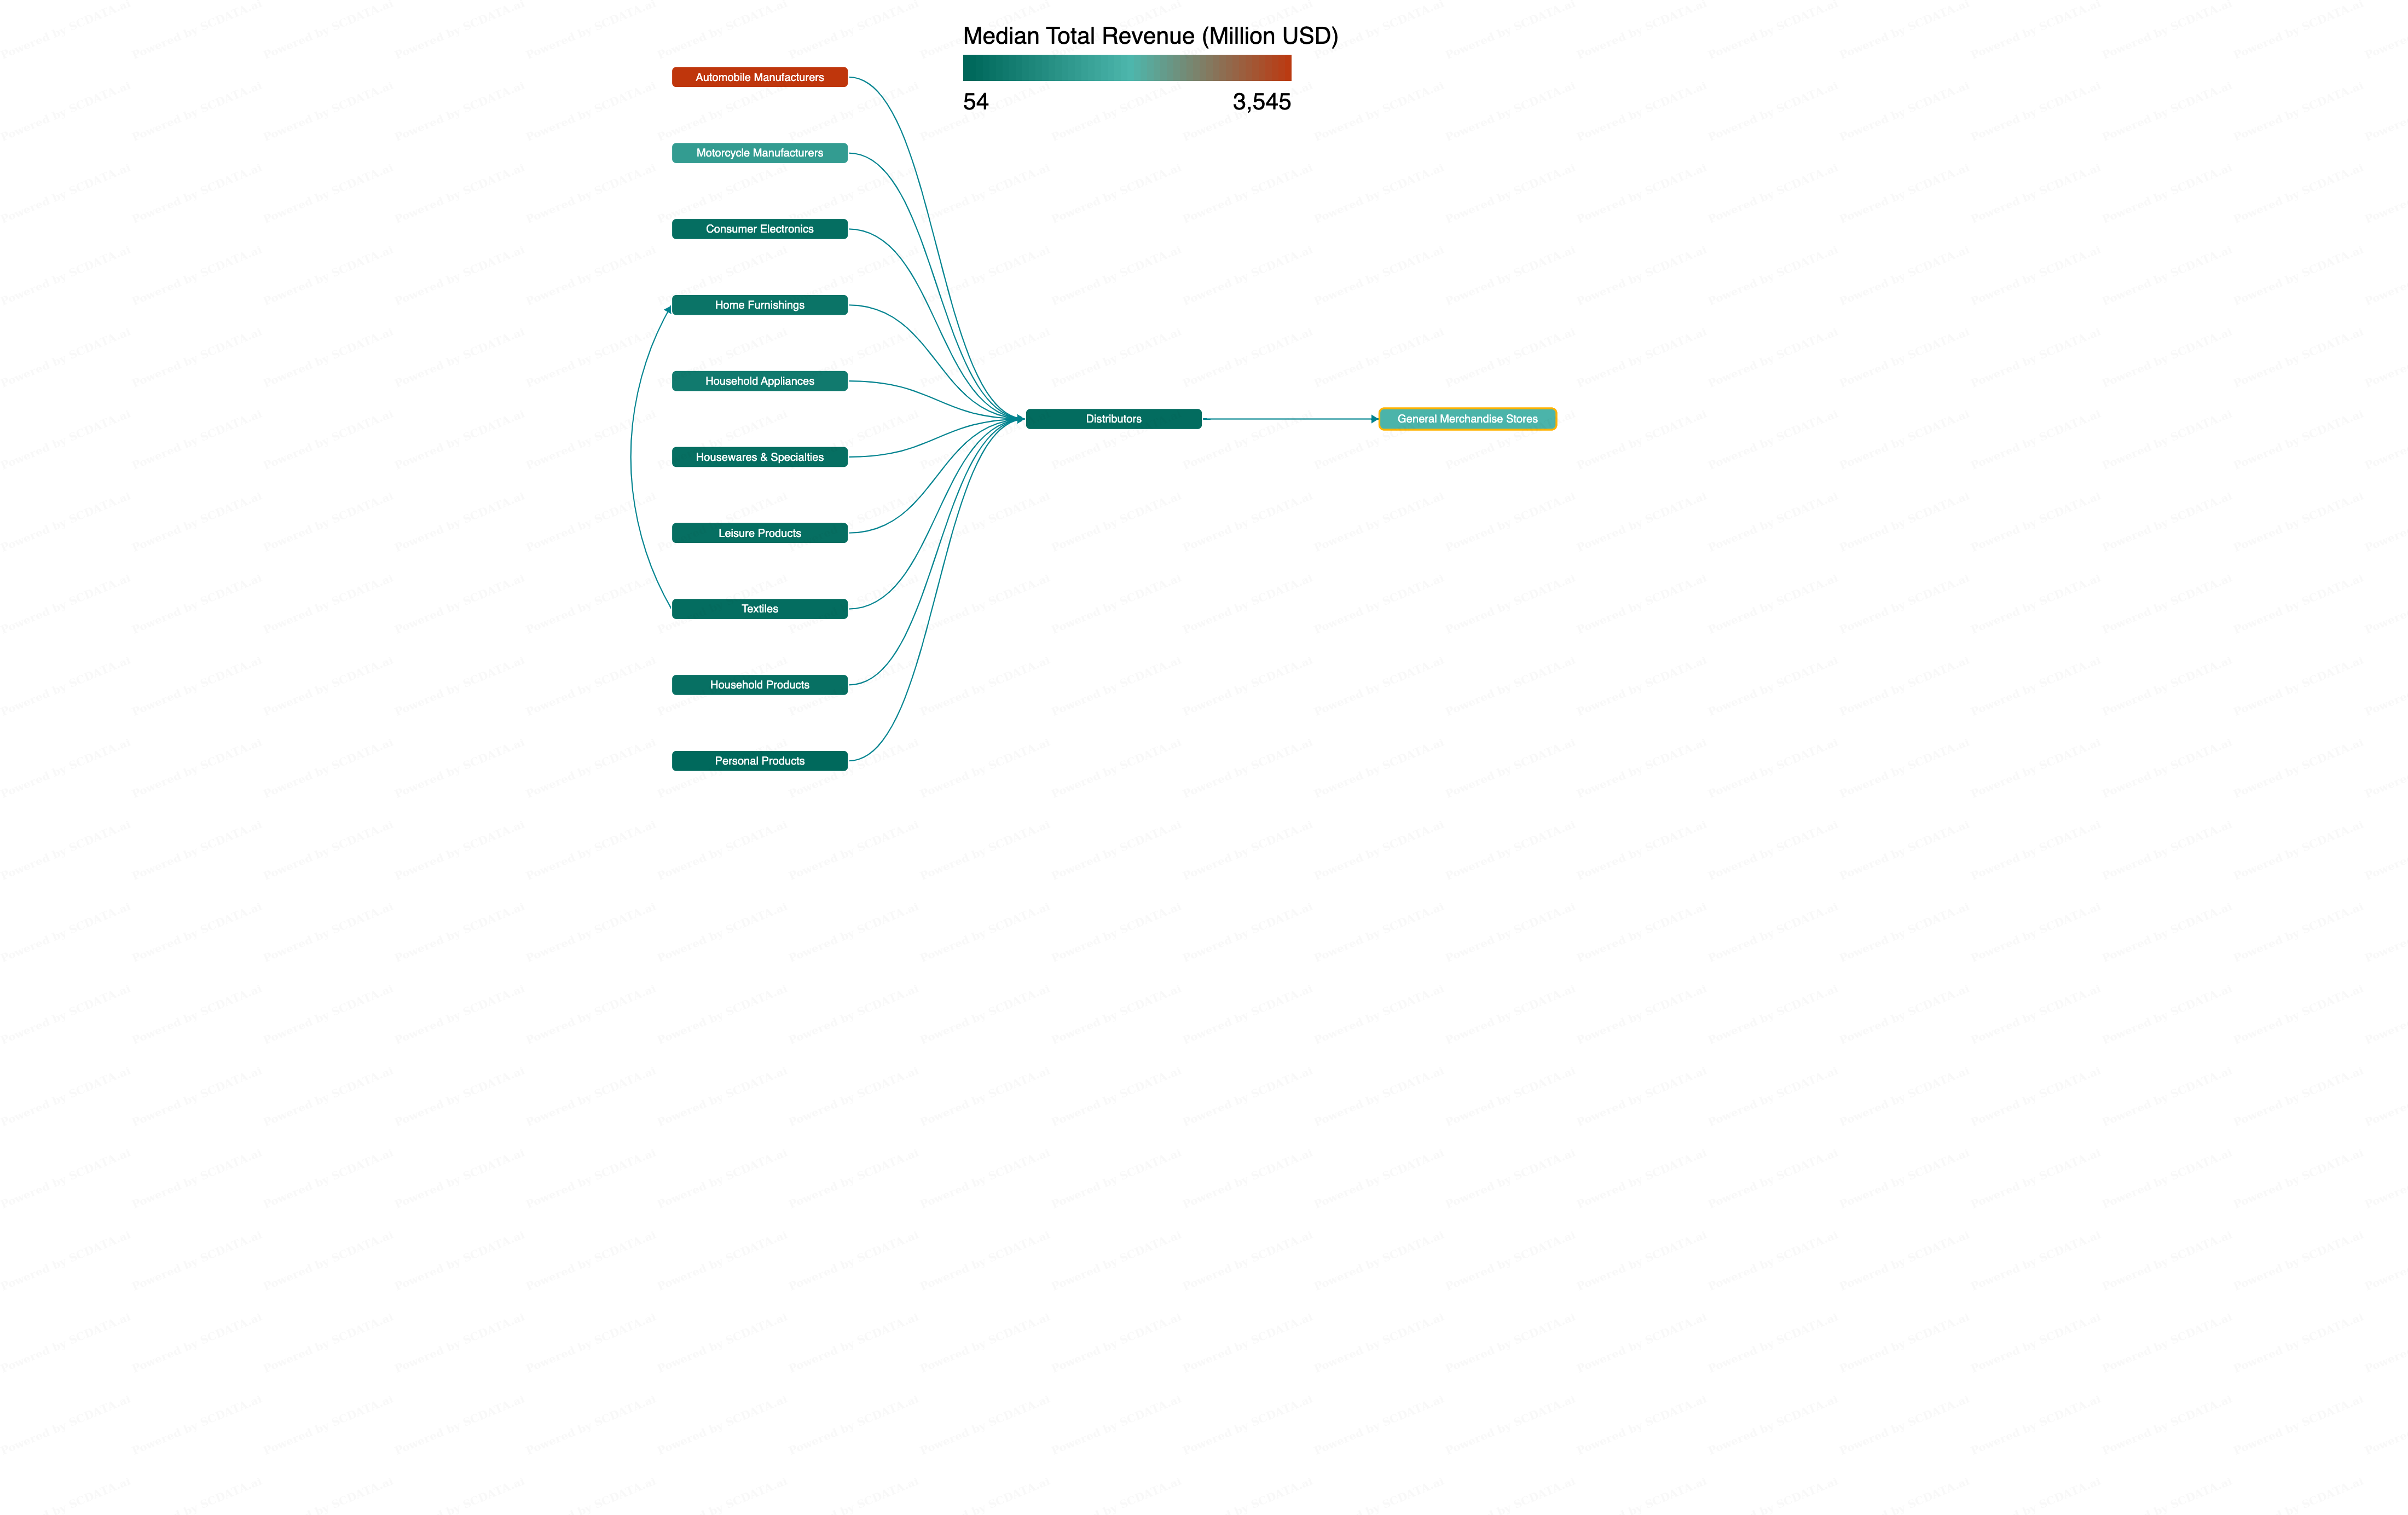
Supply Chain Mapping (Net Margin) - Global
Supply Chain Mapping - Net Margin (Global 2021)
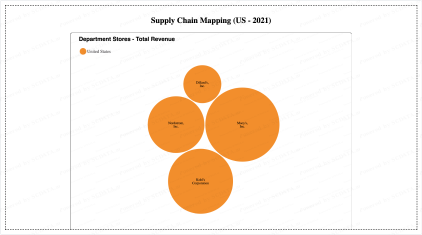
Supply Chain Mapping (US - 2021)
Phase 2
Competition Position Analysis
Step 1: Profit Frontier
Step 2: Enterprise Ranking
Step 3: Key Performance Indicator Examination
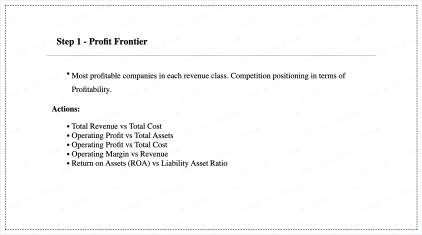
Step 1 - Profit Frontier
Most profitable companies in each revenue class. Competition positioning in terms of Profitability.
Actions:
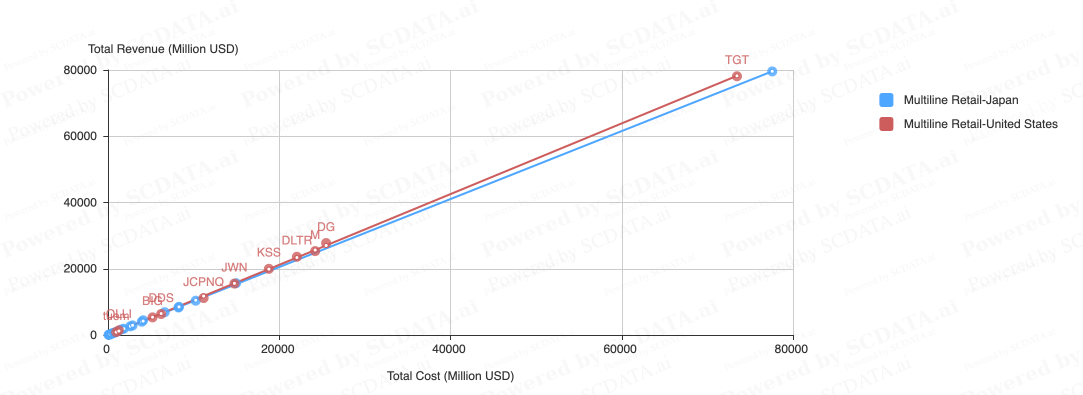
Revenue vs Cost - 2019 (Profit Frontier)
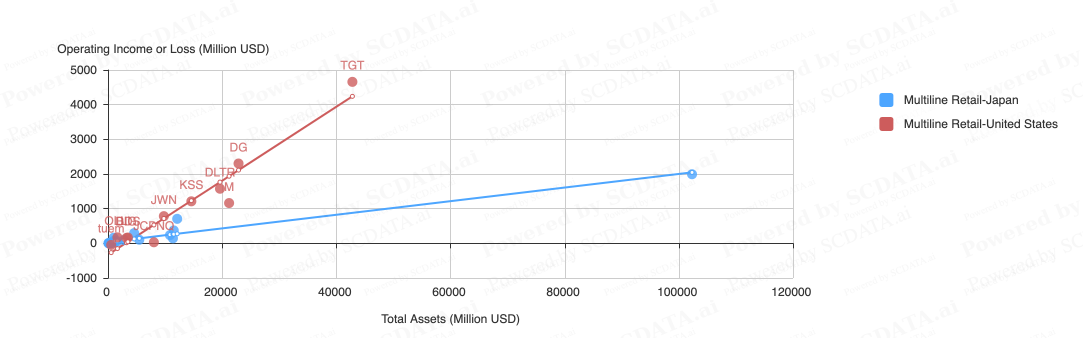
Operating Profit vs Total Assets - 2019 (Profit Frontier)
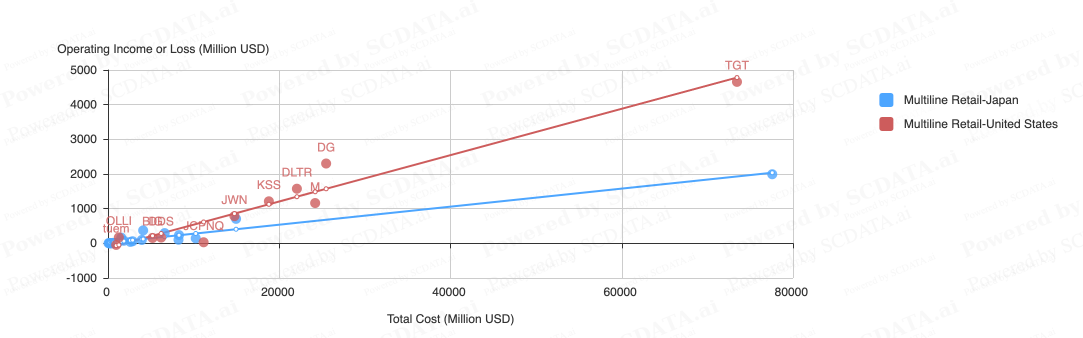
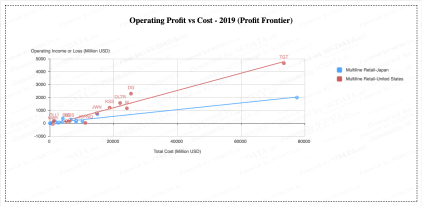
Operating Profit vs Cost - 2019 (Profit Frontier)
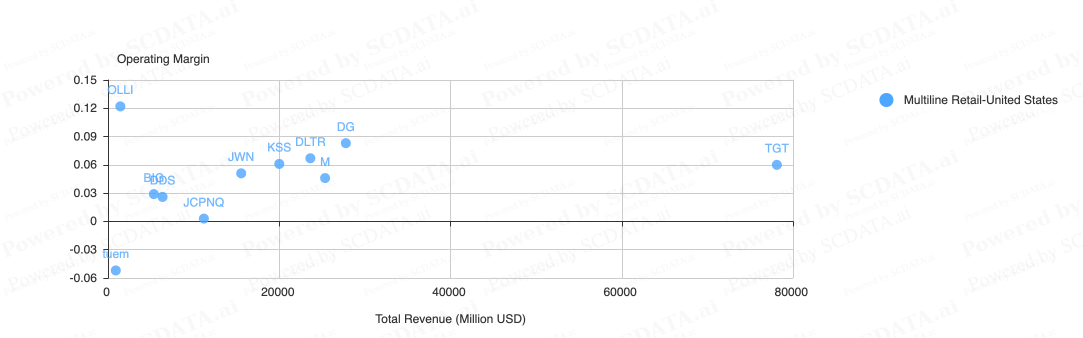
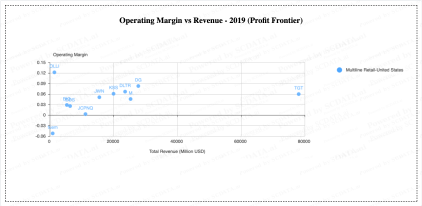
Operating Margin vs Revenue - 2019 (Profit Frontier)
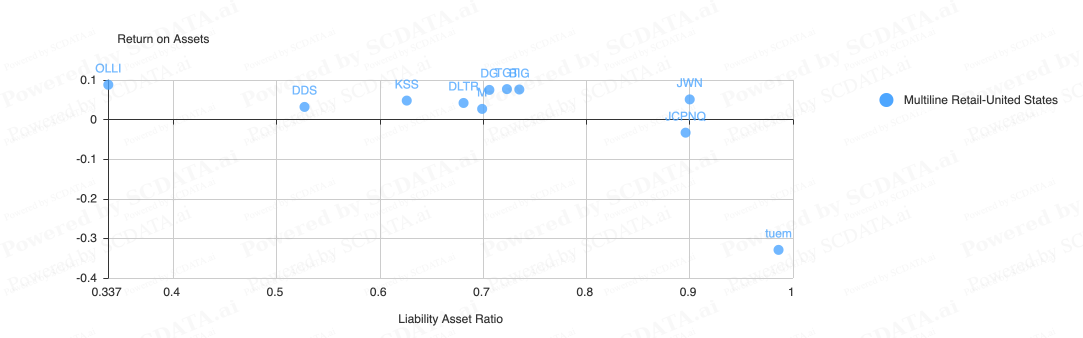
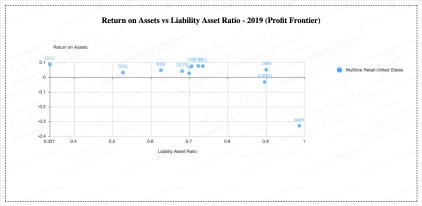
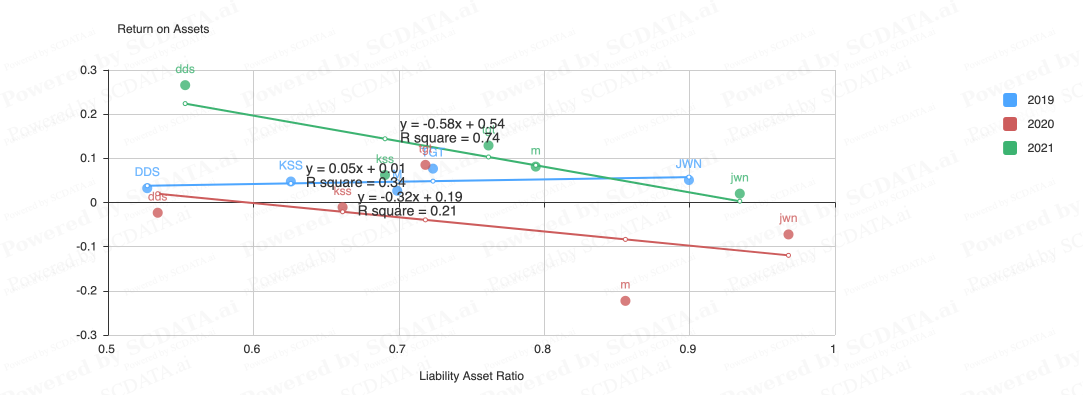
Return on Assets vs Liability Asset Ratio - 2019 (Profit Frontier)
Conclusion (Step 1)
Step 2 - Enterprise Ranking
Company placement against other companies using varied metrics.
We will focus on Nordstrom Inc (JWN), Target Corporation (TGT), Macy's Inc (M), Dillard's Inc (DDS) and Kohl's Corporation (KSS).
Actions: (Enterprise Ranking)
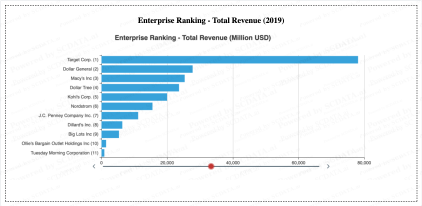
Enterprise Ranking - Total Revenue (2019)
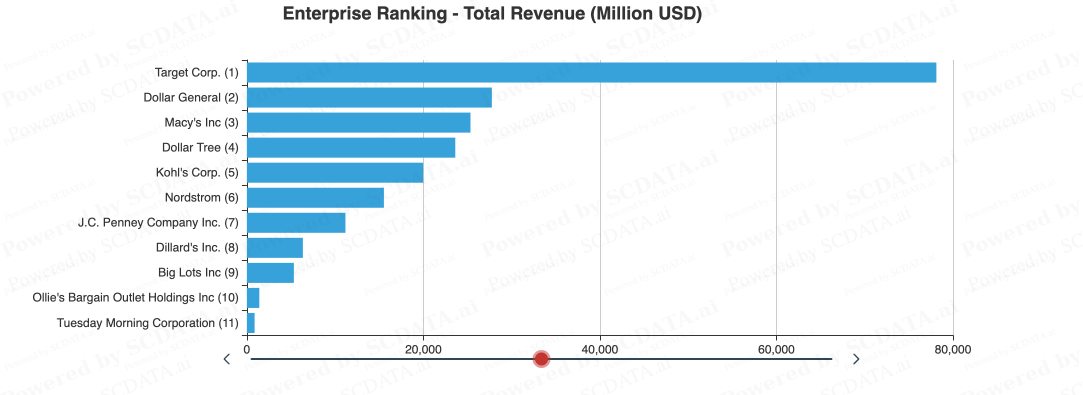
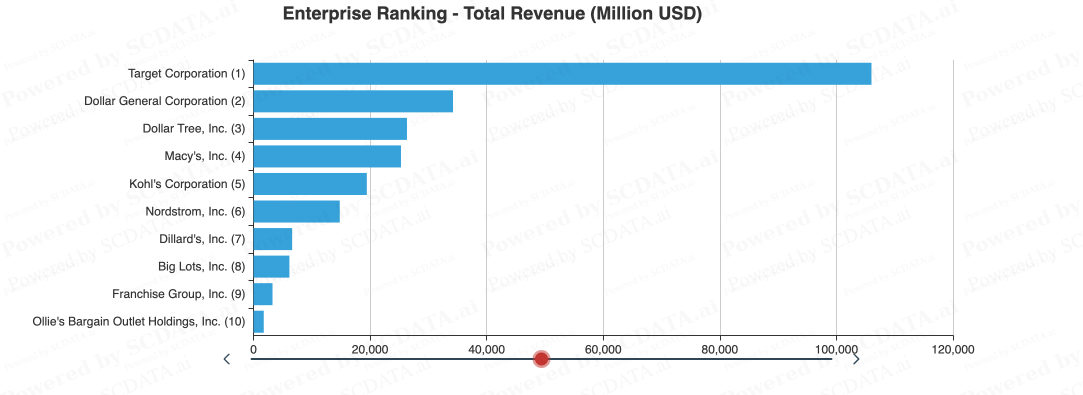
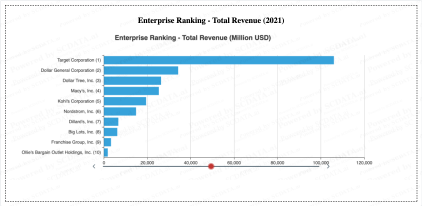
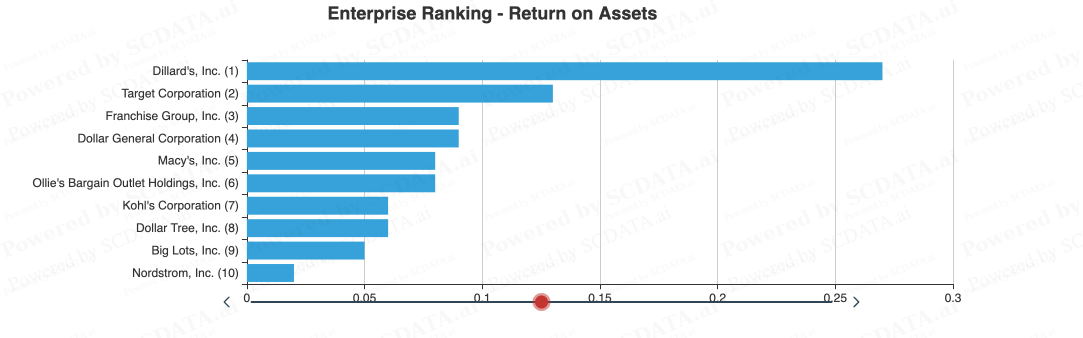
Enterprise Ranking - Total Revenue (2021)
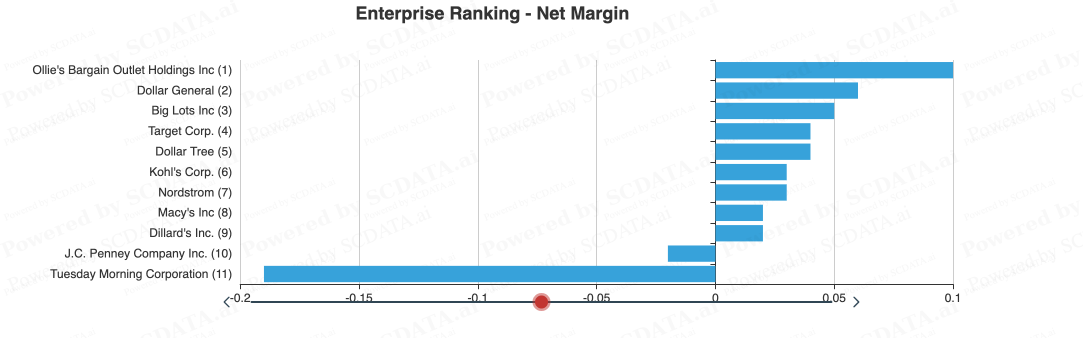
Enterprise Ranking - Net Margin (2019)
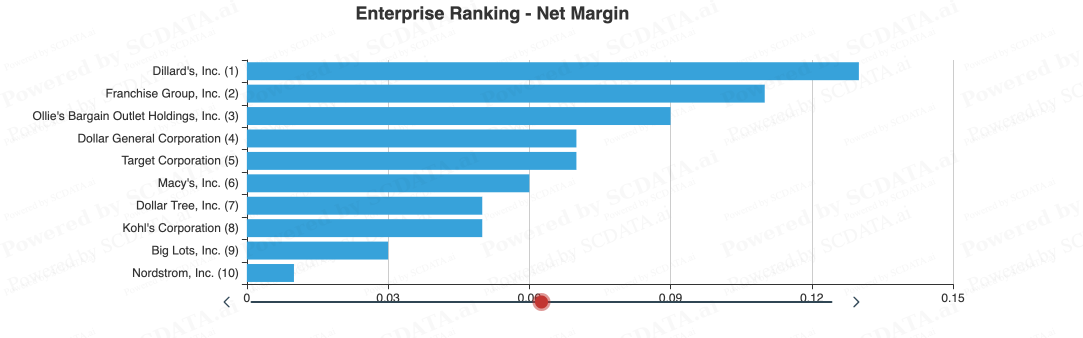
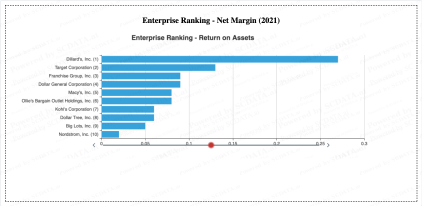
Enterprise Ranking - Net Margin (2021)
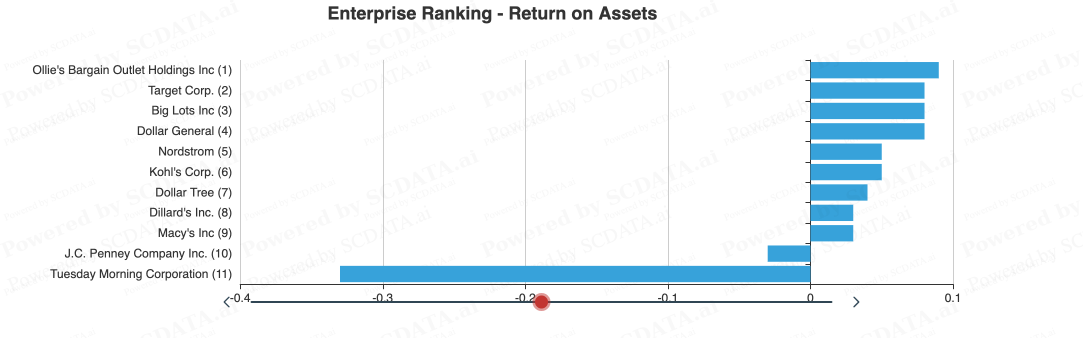
Enterprise Ranking - Return on Assets (2019)
Enterprise Ranking - Net Margin (2021)
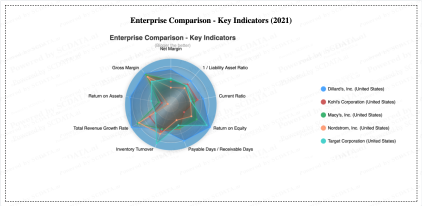
Step 3 - Key Performance Indicator (KPI) Examination
A Key Performance Indicator (KPI) examination is a process of evaluating the metrics that are critical to the success of a business or organization. KPIs are specific, measurable, and quantifiable metrics that are used to track progress towards business objectives and goals.
A KPI examination is important because it provides insights into the performance of a business or organization, and enables decision-makers to make informed decisions based on objective data. It helps to identify areas that are performing well, as well as areas that may require attention and improvement. By focusing on the right KPIs, businesses can improve their performance, enhance customer satisfaction, and achieve their strategic objectives.
Actions:
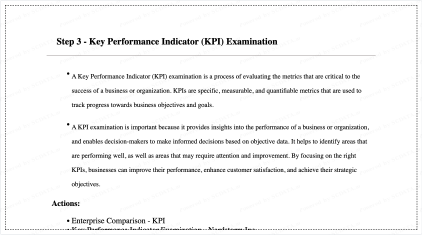
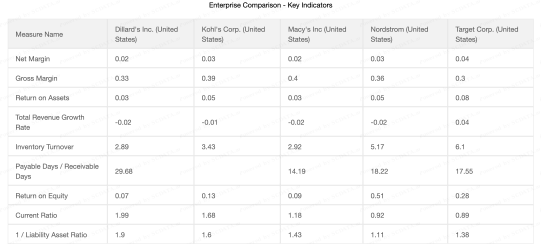
Enterprise Comparison - Key Indicators (2021)

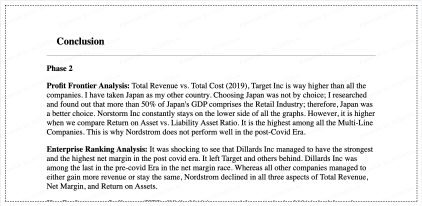
Conclusion
Phase 2
Profit Frontier Analysis: Total Revenue vs. Total Cost (2019), Target Inc is way higher than all the companies. I have taken Japan as my other country. Choosing Japan was not by choice; I researched and found out that more than 50% of Japan's GDP comprises the Retail Industry; therefore, Japan was a better choice. Norstorm Inc constantly stays on the lower side of all the graphs. However, it is higher when we compare Return on Asset vs. Liability Asset Ratio. It is the highest among all the Multi-Line Companies. This is why Nordstrom does not perform well in the post-Covid Era.
Enterprise Ranking Analysis: It was shocking to see that Dillards Inc managed to have the strongest and the highest net margin in the post covid era. It left Target and others behind. Dillards Inc was among the last in the pre-covid Era in the net margin race. Whereas all other companies managed to either gain more revenue or stay the same, Nordstrom declined in all three aspects of Total Revenue, Net Margin, and Return on Assets.
Key Performance Indicator (KPI): While 2019 is expected for everybody, 2021 is bad for only Nordstrom and Kohls. Nordstrom's individual KPI shows that it is low in almost every category and high in the Liability Asset ratio.
Phase 3
Enterprise Diagnosis
Step 1: Strengths and Weaknesses
Step 2: Value Driver Analysis
Step 3: Breakdown Analysis
Nordstorm and Competitors


Step 1- Strengths and Weaknesses
Strengths are an indicator of a company's effective use of internal techniques that are known to work well, while weaknesses highlight areas of underperforming activities that require improvement.
Actions:
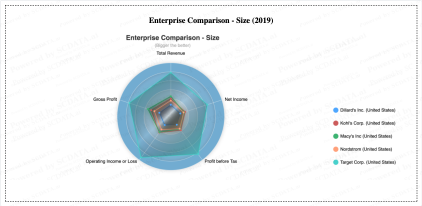
Enterprise Comparison - Size (2019)

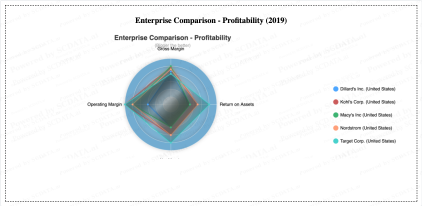
Enterprise Comparison - Profitability (2019)

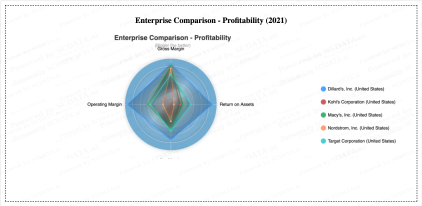
Enterprise Comparison - Profitability (2021)

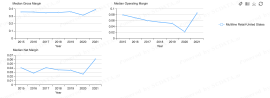
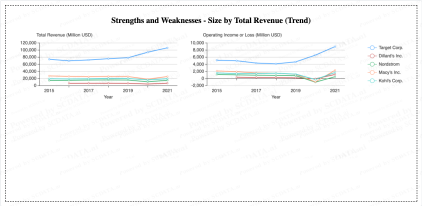
Strengths and Weaknesses - Size by Total Revenue (Trend)

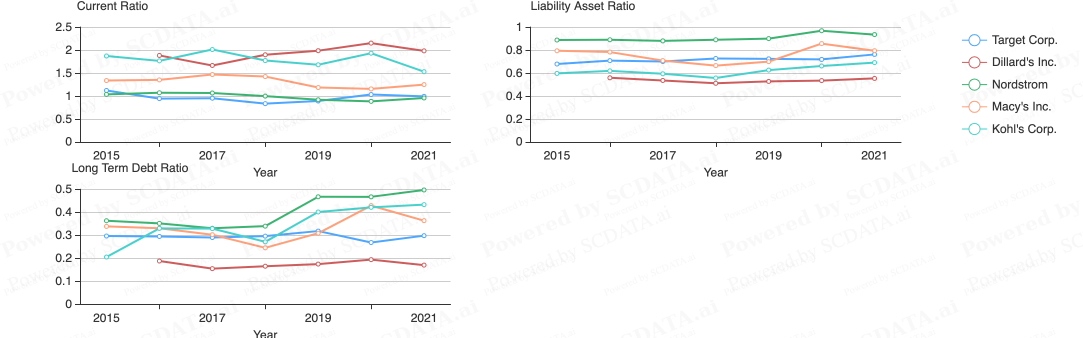
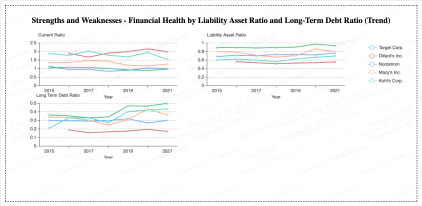
Strengths and Weaknesses - Financial Health by Liability Asset Ratio and Long-Term Debt Ratio (Trend)
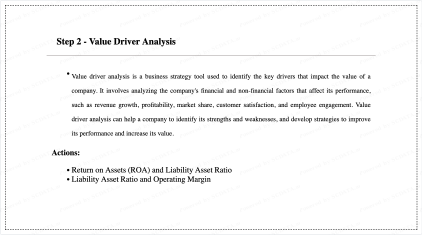
Step 2 - Value Driver Analysis
Value driver analysis is a business strategy tool used to identify the key drivers that impact the value of a company. It involves analyzing the company's financial and non-financial factors that affect its performance, such as revenue growth, profitability, market share, customer satisfaction, and employee engagement. Value driver analysis can help a company to identify its strengths and weaknesses, and develop strategies to improve its performance and increase its value.
Actions:
Value Driver Analysis - Liability Asset Ratio and Return on Assets
Step 3 - Breakdown Analysis
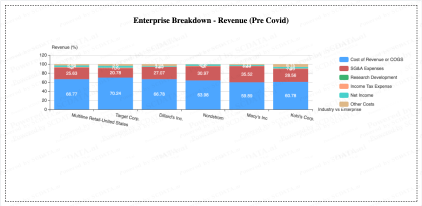
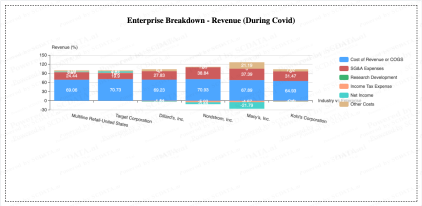
Looking at firm's COGS, SG&A Expenses, R&D, etc to compare with the industry. This could help in figuring out where a company has more spending when comparing with other companies in the same industry. (Jain, 2023)
Actions:
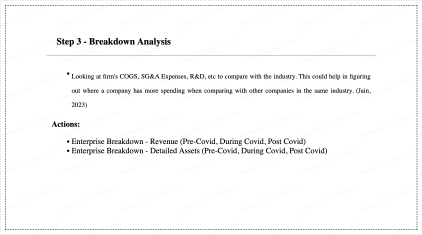
Enterprise Breakdown - Revenue (Pre Covid)
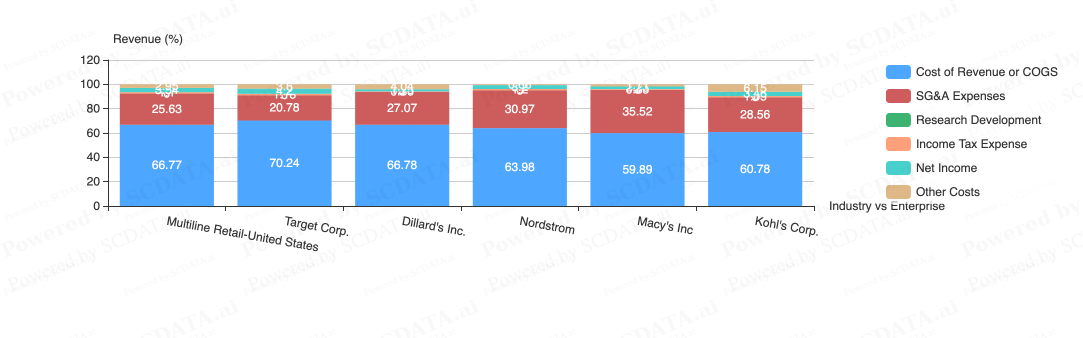
Enterprise Breakdown - Revenue (During Covid)
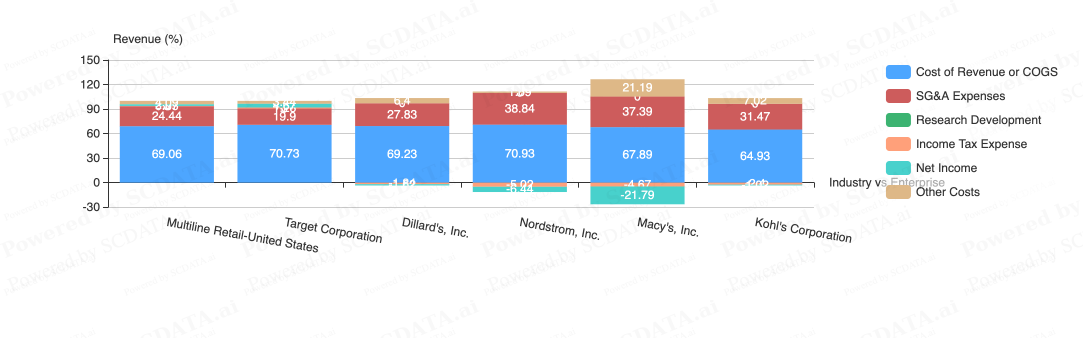
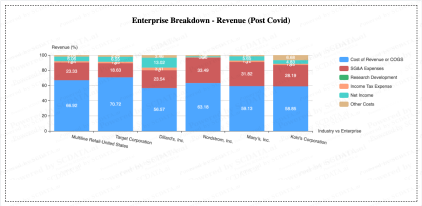
Enterprise Breakdown - Revenue (Post Covid)
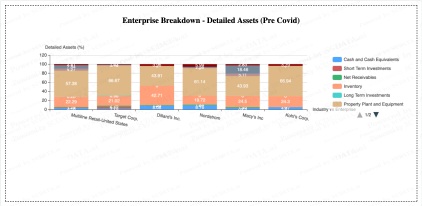
Enterprise Breakdown - Detailed Assets (Pre Covid)
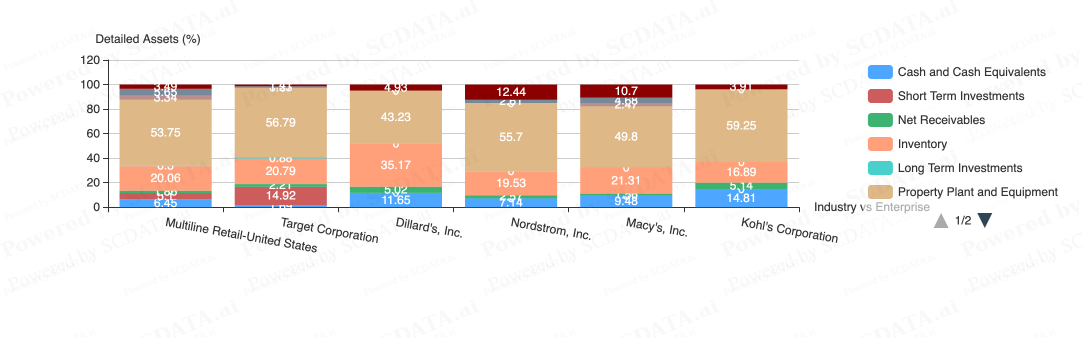
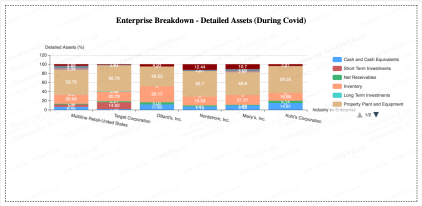
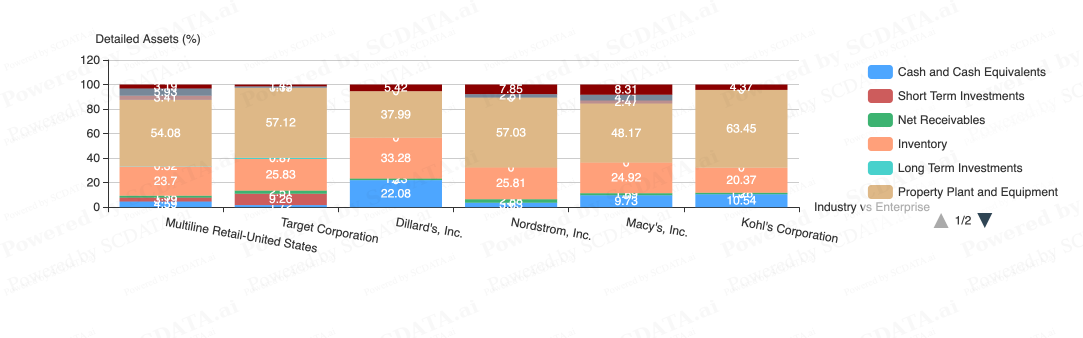
Enterprise Breakdown - Detailed Assets (During Covid)
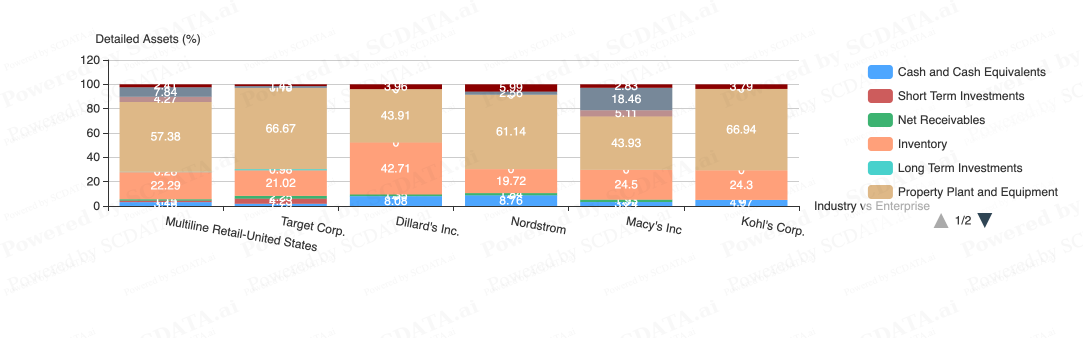
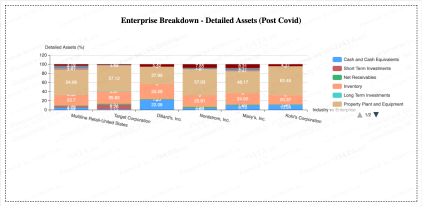
Enterprise Breakdown - Detailed Assets (Post Covid)
Conclusion
Phase 3
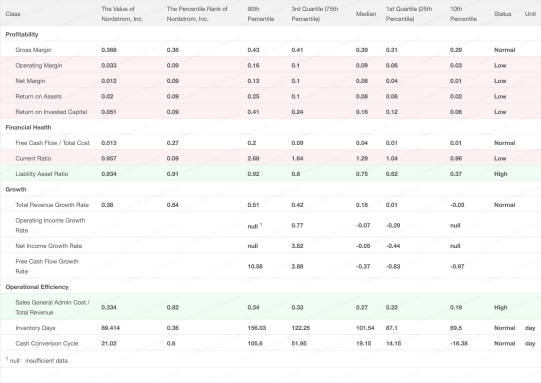
Strengths and Weaknesses: It is clear that Nordstrom's high risk, high Liability to Asset Ratio, and increased long-term debt was the leading cause for the decline in profits in the year 2021.
Value Driver Analysis: Similar to the above analysis, Nordstrom is the highest in the Liability to Asset Ratio, while Dillard's sudden increase in Return on assets remains a mystery.
Breakdown Analysis: I have done six analyses, Enterprise Breakdown (Pre-Covid, During Covid, Post-Covid) on Revenue and Detailed Assets.
- It seems Nordstrom's SG&A expenses were regular in the Pre-Covid Era; however, it had a sharp increase in the during and Post-Covid eras, comparatively more than other companies in the industry. While others had increased Cash and Cash Equivalents in 2021, Nordstrom's is close to nil.
Summary/Recommendations