Competitive Intelligence and Benchmarking
Tyson Foods, Inc. and the Food Products Industry
Nikhil Walia
Supply Chain Analytics
Dr. Yao Zhao

Tyson Foods
- Tyson Foods, Inc. is an American multinational corporation that operates in the food industry, specifically in the production, processing, and marketing of chicken, beef, pork, and other prepared food products.
- With a workforce comprising tens of thousands of employees involved in various aspects of food production, Tyson Foods reported substantial annual revenue, reaching billions of dollars.
- In 2022, 44 Tyson Foods Plants Receive North American Meat Institute's Environmental Recognition Awards. (according to www.tysonfoods.com)

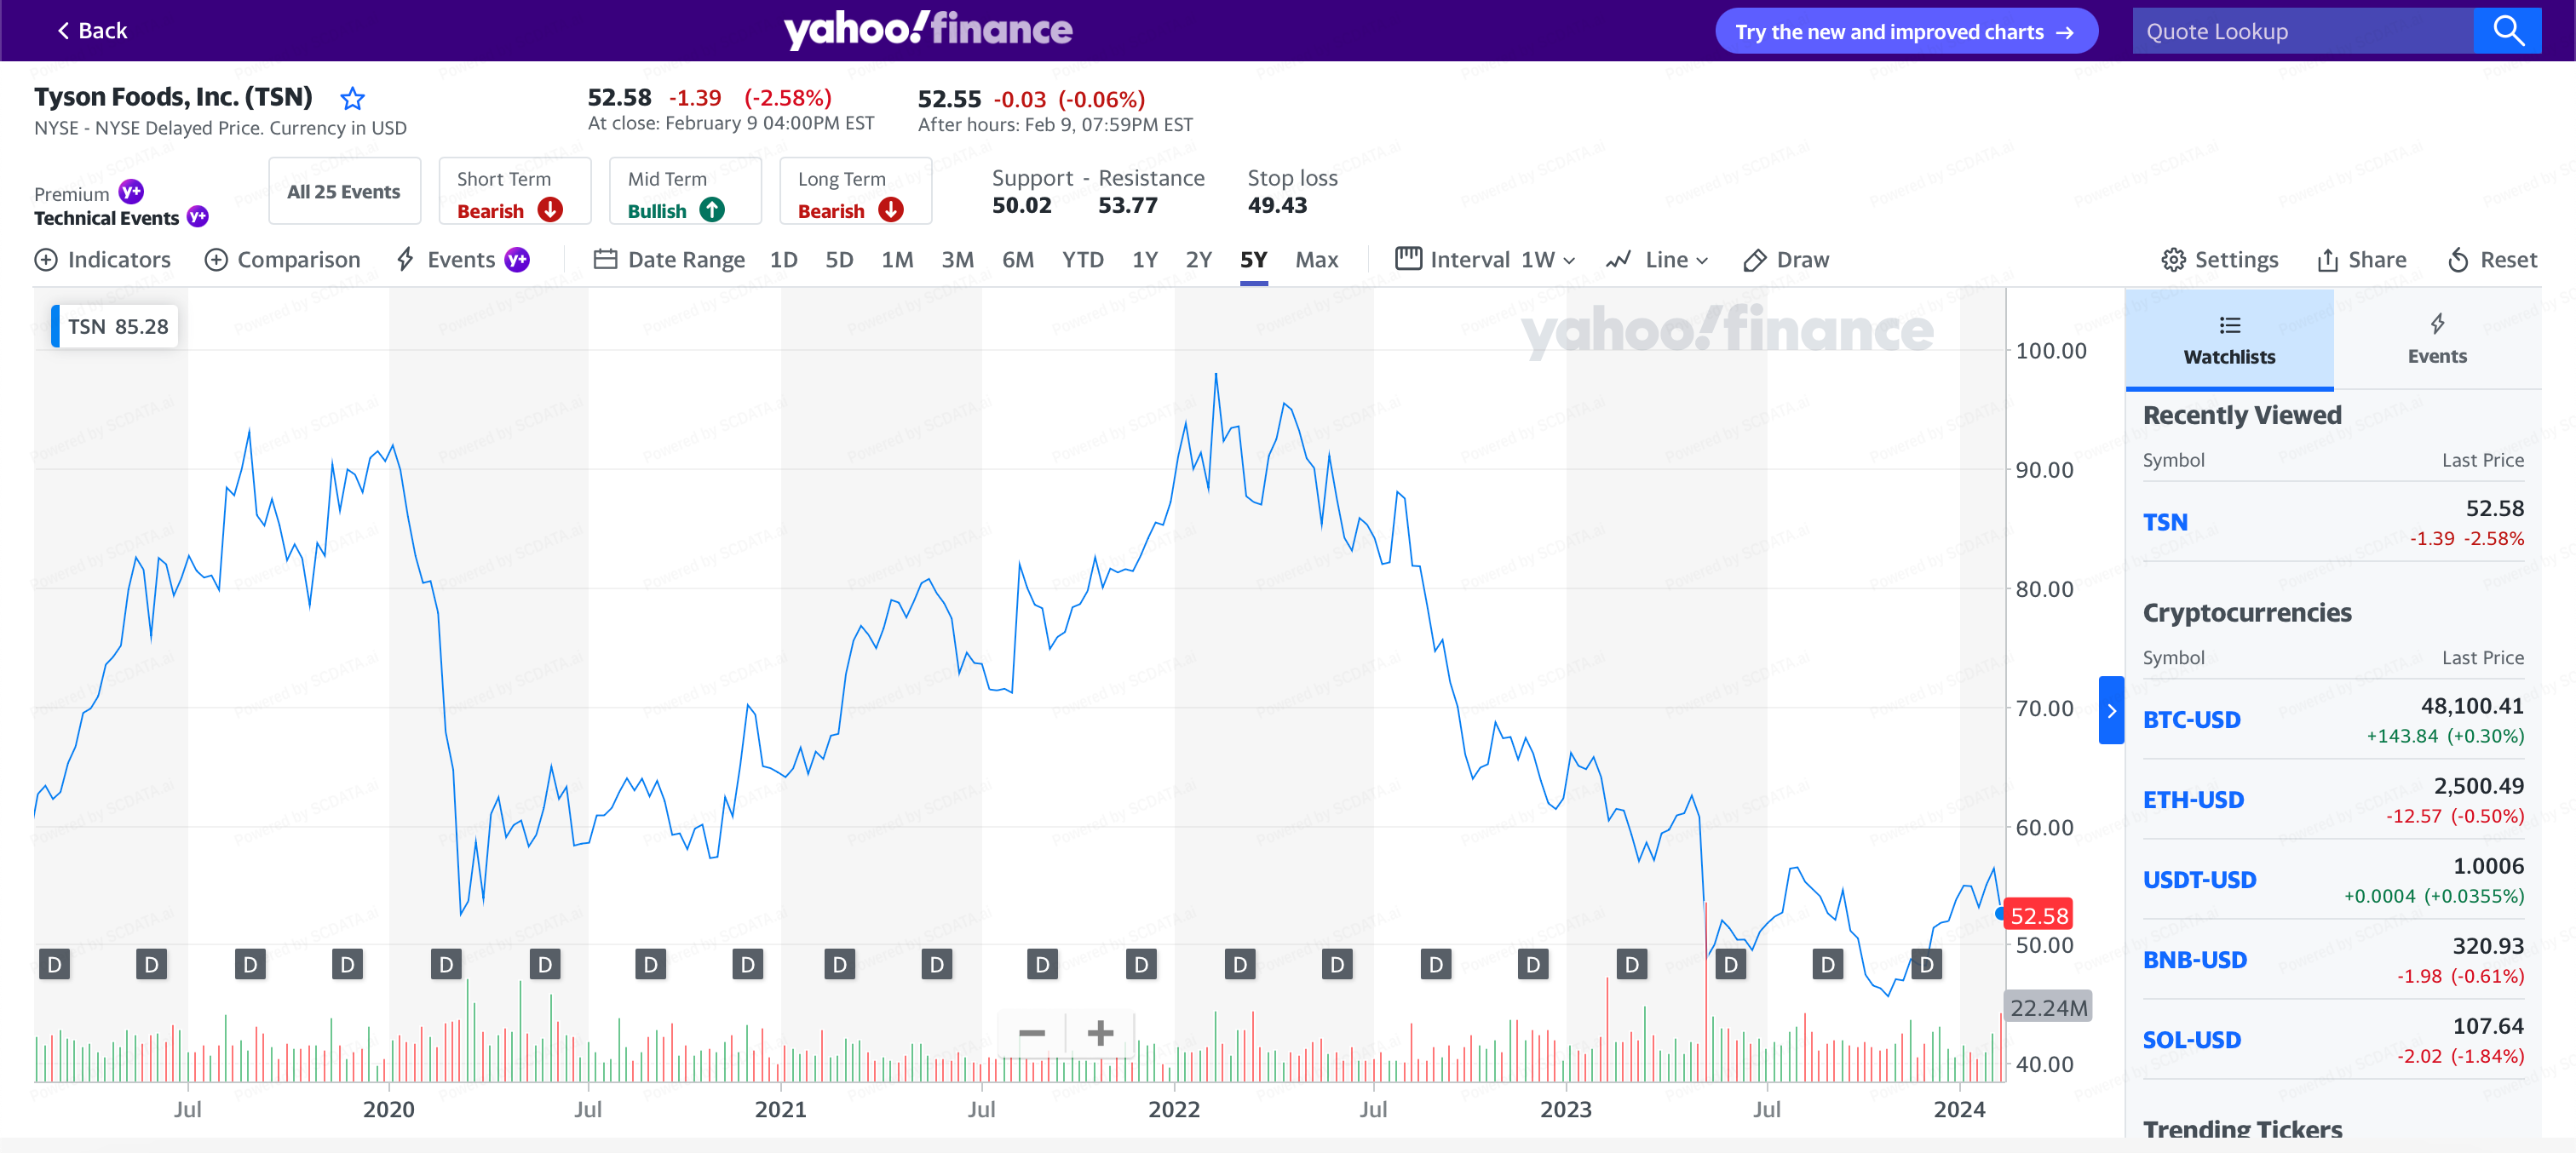
Stock Chart for Tyson Foods, Inc. (5 year period)

Industry Analysis (Phase 1)
Industry Trend Analysis
Concentration and Competition Intensity

Industry Trend Analysis

Conclusion

2. Concentration and competition intensity

Value Chain Analysis

Conclusion
On Slide 16, we can see that the top 3 with the highest net margins in the United States are Bridgeford Foods Corporation, The Hershey Company, and General Mills, Inc. This is very interesting to me because in the previous analysis we can see how Tyson was on top for certain aspects but in this instance they only have a net margin of 0.06.

Phase Two
Competition Positioning Analysis
1) Profit Frontier
2) Enterprise Ranking
3) KPI Examination

Profit Frontier
1) Revenue vs. cost,
2) net income vs. total cost or total assets
3) liability asset ratio vs. return on assets

Enterprise Ranking

KPI Examination

Conclusion for Phase Two
For the profit frontier, we can see that Tyson Foods actually lost 4 million dollars when looking at the profit vs total assets model and profit vs. cost model. Also, we can see for Packaged goods, Tyson is leading in Total Revenue compared to its competitors with a total revenue of $53.3 million. However, they have an operating margin of 0.08 while other companies like Mondelez have 0.17.
After analyzing the enterprise ranking, Tyson Foods ranked number 3 in Total Revenue for the Food Products industry. They were behind Archer-Daniels-Midland Company ($101.6 million) and Bunge Limited ($67.6 million). However, when looking at Net Margin, Tyson ranked 22nd with a net margin of 0.06. Lastly, they were ranked number 6 for Return on Assets with 0.09.

Enterprise Diagnosis
Phase 3
1) Strengths and Weaknesses
2) Value Driver Analysis
3) Breakdown Analysis

Strengths and Weaknesses
Competitors Comparing:
1) Tyson Foods
2) Mondelez International
3) Campbell Soup Company
4) Kellogg Company
5) Ingredient Incorporated
6) General Mill Inc

Value Driver Analysis

Breakdown Analysis

Conclusion for Phase Three
When comparing Tyson Foods to other enterprises, they did really well on for their Total Revenue. However companies like Mondelez International overshadowed them with their gross profit being significantly higher. Tyson Foods struggles to get beat this industry in terms of gross profit but were able to do better when looking at the profit before tax. To add on, Tyson Foods was equally as good as General Mill in return on Assets but struggled with their operating margin (only 0.08). General Mills (0.17 operating margin) more than doubled their operating margin. Tyson Foods also only had a financial health margin of 0.06 which was one of the lowest compared to other companies like General Mills, Kellogg Company, Mondelez International, etc.


