Industry classification

5
Purpose of Industry Classification
Basis of Grouping: Companies categorized based on similar products/services and customer/supplier profiles.
Government Use: Utilized by agencies to monitor economic trends and conditions.
Securities Analysis: Employed by analysts for portfolio construction and market analysis.
Consulting Application: Used by consultants and analysts for problem identification and cause diagnosis.
5/51
Insights into supply chain

6
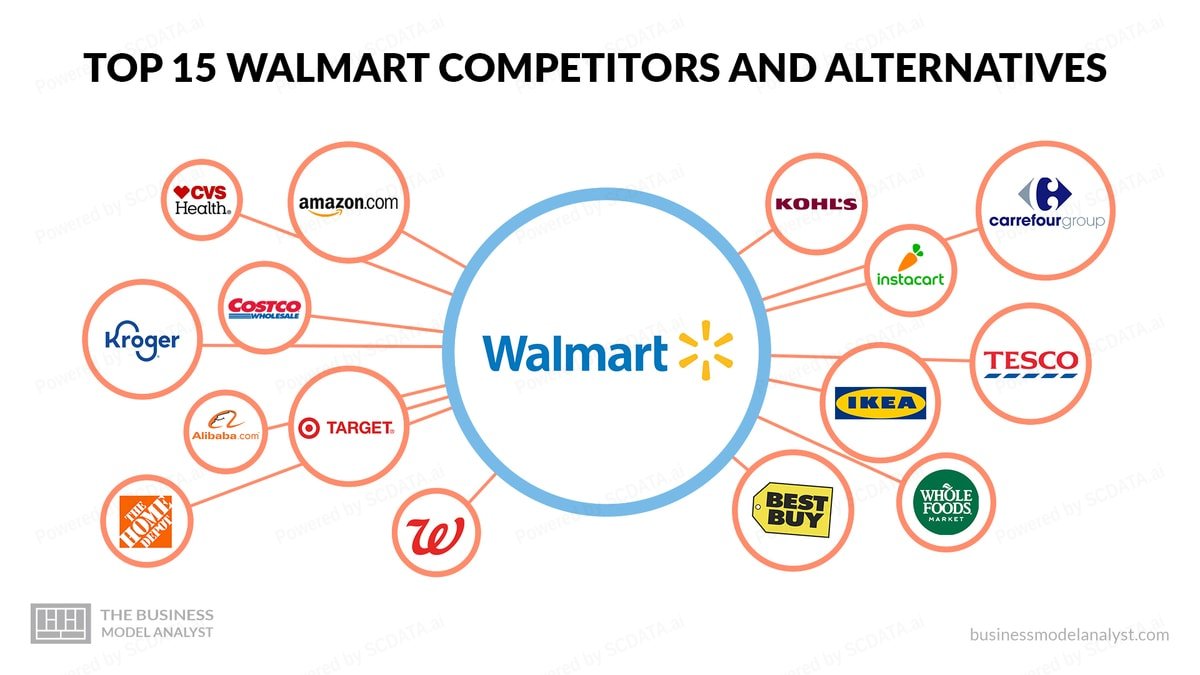
Walmart's Industry Ecosystem
Supplier Network: Walmart sources from a diverse range of suppliers including global manufacturers, local farmers, and consumer goods companies, ensuring a wide variety of products.

Product Categories: Offers an extensive range of products from groceries, electronics, apparel, to home goods, catering to everyday consumer needs.

Customer Demographics: Serves a broad spectrum of customers, from individual consumers to small businesses, with a focus on providing value and convenience.

Market Influence: Walmart's purchasing decisions significantly impact supply chains and product availability in the retail industry, setting trends and standards.
6/51
Market Structure and Enterprise Spread

8
United States: Walmart's largest market, serving as the cornerstone of its operations with the highest number of stores and revenue.

International Footprint: Significant presence in key markets including China, Canada, the UK, and parts of Latin America, adapting to local consumer preferences.

Growth Markets: Highlighting strategic expansions in emerging markets, with a focus on leveraging e-commerce and local partnerships.

Comparison with Global Industries: While not directly analogous to semiconductor revenue distribution, Walmart's international strategy reflects its pursuit of dominance in diverse markets, similar to leading countries in the semiconductor industry.

Market Adaptation: How Walmart tailors its offerings in different regions to compete with local and international retailers, ensuring relevance and competitive edge.
8/51
Enterprise Distribution

9
The bar chart effectively illustrates the leading positions of the US, Japan, China, and France within the Consumer Staples sector, showcasing their respective market shares and highlighting the US as the predominant leader.
9/51
Industry Overview: Market Size and Trends in Consumer Staples across the US, China, Japan, and India.

10
The Consumer Staples sector is expanding in China, with significant increases in revenue and profitability, though recent trends suggest possible challenges in maintaining profitability. The U.S. market shows stability in revenue and a high proportion of profitable enterprises but faces challenges in sustaining net income growth. Japan's sector appears to be stable with concerns over slightly decreasing profitability, while India shows potential for growth with increasing net income and profitability.
10/51
Profitability Distribution by Industry - net margin distribution, US semiconductors 2022

11
Most companies made a profit in 2022
11/51
Market share analysis

14
The chart suggests a market where Walmart leads by a wide margin, followed by Costco with a solid but notably smaller market share. BJ’s and PriceSmart hold smaller portions of the market. The visual data does not suggest any dramatic shifts in market share between these companies from 2016 to 2022, implying a stable competitive environment where smaller companies maintain their position without significant growth or erosion of their market shares. This stability suggests that while the market may be competitive, there's room for various-sized companies to survive and potentially thrive. We can also see walmarts share is gradually decreasing and costco increasing gradually.
14/51
Global Giants: Mapping Hypermarkets & Supercenters

15
Walmart is still the biggest in the world followed by costco
15/51
Net Income Landscape: Walmart Leads, Costco Follows

16
The perspective of the net income is also similar with walmart followed by costco
16/51
Revenue vs. Cost

18
To provide a more detailed analysis of the hypermarket and supercenter industry across the US, Japan, and China, we conduct a comparative revenue-vs-cost assessment to gauge the relative market sizes and operational efficiencies within these regions. Our analysis reveals that US-based companies are markedly ahead in terms of revenue generation, which suggests a larger market size and potentially greater economies of scale. This commanding lead implies that US companies have a significant influence on market trends and consumer behaviors.

In contrast, Japanese companies in this sector appear considerably smaller when evaluated by the same financial metrics. This could indicate a more fragmented market or a focus on efficiency over scale. It may also reflect different consumer patterns or competitive landscapes in Japan compared to the US.
18/51
Profit vs. Cost - Operating Income

19
In our subsequent analysis, we delve into the profitability of the hypermarket and supercenter industry within the US, Japan, and China through a profit vs. cost evaluation. This assessment provides a clearer picture of operational effectiveness and profit margins. The data indicates that while US companies typically showcase robust profitability, the aggregate trend is somewhat skewed due to Costco's performance, which brings down the overall regression line. Meanwhile, the landscape in China presents a different scenario; the majority of Chinese companies demonstrate profitability, reflecting a healthy competitive environment and effective cost management strategies. This suggests that despite diverse market conditions, companies in both the US and China have found successful formulas for profitability within this industry.
19/51
Operating Margin vs. Revenue

20
The scatter plot illustrates the operating margin against total revenue for companies in the hypermarkets and supercenters sector across China, Japan, and the United States. Walmart (WMT) stands out with high total revenue and a healthy operating margin. In contrast, Costco (COST) shows a substantial revenue with a comparatively lower operating margin. Chinese and Japanese companies cluster mostly towards the lower end of the revenue axis, indicating smaller scales of operation with varying margins.
20/51
Return on Assets vs. Liability Asset Ratio - 2022

21
The scatter plot compares companies in the hypermarkets and supercenters sector on the basis of their Return on Assets (ROA) and Liability Asset Ratio (LAR). Walmart (WMT) and Costco (COST) show a higher ROA, indicating efficient asset utilization. BJ's (BJ) has a moderate ROA with lower leverage, while companies represented by 6808.HK and 002336.SZ have lower or negative ROA, suggesting less efficient asset use or challenging market conditions.
21/51
Enterprise Ranking - Total Revenue, US, China, Taiwan

24
Net income perspective: Walmart #1, Costco#2, BJs #3
24/51
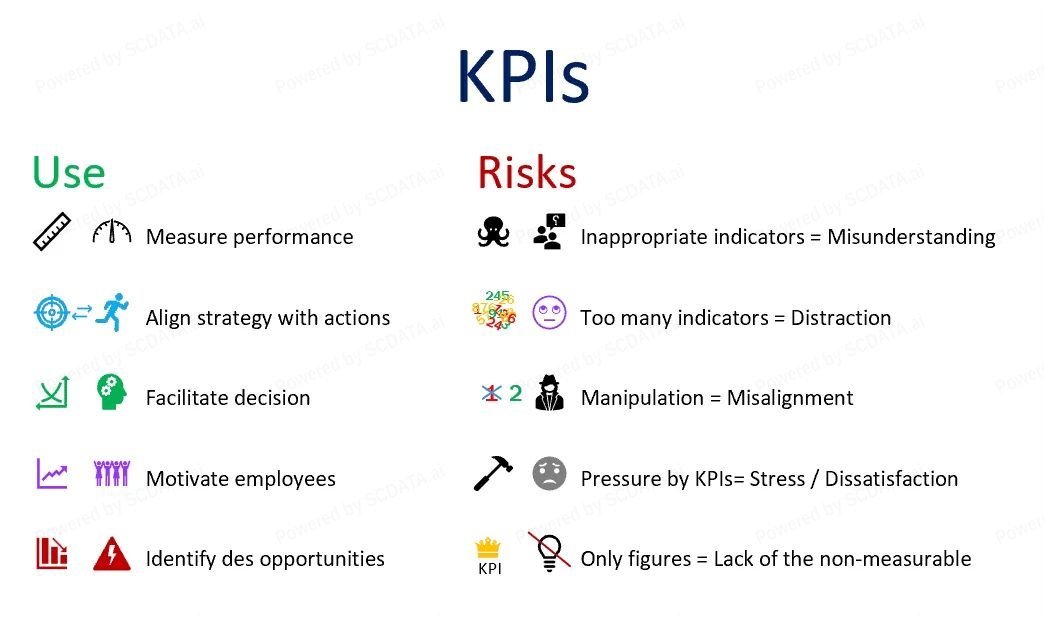
KPI Examination of Walmart

26
The table provides a KPI analysis for Walmart Inc., comparing it against industry benchmarks. Walmart exhibits high profitability with strong gross and operating margins. Financial health is sound, indicated by normal current and liability asset ratios. Growth metrics such as revenue and net income growth are low, suggesting stability rather than rapid expansion. Operational efficiency is mixed, with high SG&A costs, yet maintaining normal inventory turnover and cash conversion cycles.
26/51
Enterprise Comparison - Size

30
The radar chart provides a comparative analysis of key financial metrics across different enterprises within the retail sector. Walmart Inc. shows the most extensive coverage across all metrics, indicating a strong performance in total revenue, net income, and other financial areas. The chart suggests Walmart has a substantial lead over competitors like Costco, BJ's Wholesale Club, Makita, and PriceSmart. This visual comparison underscores Walmart's dominance in the market, reflecting its comprehensive scale and profitability relative to its peers.
30/51
Enterprise Comparison - Profitability

31
The radar chart presents a profitability comparison of various enterprises, including Walmart. Walmart's performance is robust across most profitability metrics such as gross margin, operating margin, and return on assets, indicating efficient management and strong financial health. However, the chart shows that in terms of net margin, Walmart may not be leading, suggesting that while it excels in generating revenue and controlling operational costs, there is a narrower gap between its earnings and expenses compared to some competitors. This could point towards potential areas for Walmart to optimize costs or increase margins to enhance net profitability.
31/51
Enterprise Trend - Size

32
The line charts depict a financial performance comparison over several years among major retailers, including Walmart. Walmart (shown in red) maintains a substantial lead in total revenue, indicating its dominant market position. However, the profit before tax and net income for Walmart exhibit volatility, with a notable dip and recovery around 2019-2020. This fluctuation suggests that while Walmart's sales are consistently high, its profitability experienced challenges during that period, potentially from operational or market factors. The other companies shown in green, like Costco, also display growth in total revenue, but at a much lower scale compared to Walmart.
32/51
Enterprise Trend - Profitability

35
The graph shows that Walmart Co. Ltd. has the highest gross margin and net margin of the four companies. However, its return on assets are lower than Costco, Pricesmart and BJ's and Costco.


Costco has a high return of assets than others
Makiya has the lowest net margin, operating margin, and return on assets of the four companies.
35/51
Enterprise Trend - Profitability

36
The image shows the profit margins and return on assets for four companies over seven years. Walmart has the highest profit margins but the low return on assets. Costco has the highest return on assets but lowest profit margins. BJ's in the middle, and Makiya has the lowest return on assets.
36/51
Value Driver Analysis - For Walmart across multiple years

39
Plotting walmarts gross margin and total revenue growth rate over multiple years on the same graph, we found a strong neagtive correlation between them, that is, a higher gross margin is highly correlated with a higher revenue growth, implying a higher gross margin is not leading to a faster revenue growth.

Need to ensure x and y are comparable in magnitude / unit, for example, if x is a ratio, then y should be a ratio, if x is in $, then y should be in $.
39/51
Value Driver Analysis - For Costco across multiple years

40
Applying the same analysis to Costco, we can make a similar observation. T
40/51
Value Driver Analysis - for SP500 Supermarket companies, 2022

41
For retail companies high gross margin doesn't convert to high revenue growth! So in this innovation driven market, price reduction may be a good strategy. Innovative and highly priced products are often also hot sellers.
41/51
Value Driver Analysis - for SP500 semiconductor companies, 2022

42
For supermarket companies , high gross margin (high value-added products) doesn't give a high net margin! Changing net margin to operating margin gives a similar result.
42/51
Enterprise Breakdown - Revenue 2022

44
Most companies have a significant portion of their revenue consumed by COGS, with varying amounts allocated to SG&A and other expenses. A few companies show net income, which is the remainder after all expenses are subtracted from total revenue.
44/51
Enterprise Breakdown - Revenue 2021

45
The largest segment in each bar is Cost of Revenue or COGS, followed by smaller segments for SG&A, Research Development, and others. Some companies show a net income segment at the top, indicating profitability, while others have segments extending below zero, suggesting a loss. The chart provides a comparative overview of cost structures and profitability across these entities.
45/51
Enterprise Breakdown - Detailed Assets 2022

46
Walmart's bar indicates a significant portion of assets in 'Long Term Investments' and 'Property, Plant, and Equipment'. There's a smaller but notable amount in 'Inventory' and 'Total Receivables'. Compared to other companies, Walmart has a moderate amount in 'Cash and Cash Equivalents', and very little in categories like 'Short Term Investments', 'Net Intangible Assets', and 'Other Assets'. This suggests a solid base in tangible assets and a strategy focused on long-term investments.
46/51
Enterprise Trend - Growth

47
Four line graphs tracking financial growth metrics for Walmart, Costco, PriceSmart, and BJ's from 2016 to 2022. Total revenue growth rates fluctuate yearly, with no company showing a steady trend. Operating income growth rates are equally volatile, with occasional spikes suggesting periods of significant growth. Net income growth rates are erratic, with notable peaks for certain companies, indicating years of substantial profit increases. Free cash flow growth rates are the most variable, particularly with an extreme peak and subsequent fall for one company in 2020-2021, reflecting a temporary surge in cash availability.
Walmart's total revenue growth rate demonstrates modest fluctuations compared to others, suggesting steady business without extreme growth or contraction. Its operating income growth rate mirrors this relative stability, though with some declines around 2021. Notably, Walmart's net income growth rate exhibits a significant spike in 2019, indicative of a profitable fiscal period, followed by a sharp decrease in 2020. The free cash flow growth rate for Walmart shows resilience, with less volatility than competitors, reflecting a consistent cash generation with a slight decline towards 2022.
47/51
Enterprise Trend - Financial Health

49
Walmart maintains a steady current and liability asset ratio, suggesting stable liquidity. Its long-term debt ratio is moderate, implying manageable debt levels. Financial leverage is variable but dramatically drops in 2022, indicating a significant change in capital structure, possibly due to debt reduction or equity increase. Overall, Walmart exhibits financial stability with potential deleveraging recently, suggesting a conservative financial strategy.
49/51
Enterprise Trend - Valuation

50
Based on the various financial charts provided, Walmart shows a stable trend in market capitalization, suggesting steady investor confidence. Its current and liability asset ratios indicate a consistent ability to meet short-term obligations. The long-term debt ratio is relatively low, suggesting prudent debt management. Financial leverage spiked but then normalized, indicating a possible one-time event affecting debt levels. Price/earnings ratios fluctuate, reflecting changing market sentiments and earnings stability. Walmart's dividend payout saw a spike, indicating a potential one-off return to shareholders. Overall, Walmart maintains financial stability with moments of strategic financial decisions.
50/51