Walmart's Industry Classification: Consumer Staples/Food & Staples Retailing/Food & Staples Retailing/Hypermarkets & Super Centers

3
In 2023, Walmart's closest competitors in the U.S. Food & Staples Retailing are (1) Costco, (2) BJ's Wholesale, and (3) Price Smart
3/52
Walmart is mainly a B2C company, working with various distributors

4
Note: The supply chain mapping provides a value chain mapping, not Walmart's actual supply chain. Walmart also works directly with major consumer goods manufacturers, which is not reflected in the supply chain mapping.
4/52
Enterprise Distribution - Enterprise Distribution

6
In 2023, US Consumer Staples/Food & Staples companies come mostly from California.
6/52
Typical Firm Performance by Region - Profit Distribution

7
The firms in Arkansas are much bigger than those in California
7/52
Typical Firm Performance by Region - Profit Distribution

8
The firms in Arkansas are much bigger than those in the rest of the countries
8/52
Concentration and Competition Intensity - Total Revenue

9
US Food and Staples Retailing Industry is dominated by a few large firms
9/52

11
In 2023, globally, Walmart's closest competitors are (1) Costco (US), (2) Carrefour (France), (3) E-Mart (South Korea)
11/52
KPI Distribution by Industry

12
US Food & Staples Retailing industry: > 50% of companies make a profit in 2023.
12/52
Industrial Trend - Industry Total Size

13
US firms are the largest and growing, stable operating income and net income. However, US and China markets are very competitive.
13/52
Revenue vs. Cost

16
Walmart is the largest retailer. Top retailers have similar Total Revenue/Total Cost ratios.
16/52
Profit vs. Cost - Gross Profit

17
Walmart has a higher gross margin than Costco.
17/52
Profit vs. Cost - Operating Income

18
Walmart’s and Costco’s operating profitability are above the industry average. CVS is very profitable
18/52
Profit vs. Cost - Operating Income

19
Walmart’s Net Income performance is below average.
19/52
Operating Margin vs. Revenue

20
Walmart and Costoc have similar operating margin, CVS and SYY have higher operating margins.
20/52
Return on Assets vs. Liability Asset Ratio

21
Walmart is the second best on both ROA and financial health. Costco is the best on both.
21/52
Enterprise Ranking - Total Revenue

23
Walmart: 1st  in size
Costco: 3rd in size
23/52
Enterprise Ranking - Operating Margin

24
Walmart: 15th
Costco: 13th
in Operating Margin
24/52
Enterprise Ranking - Operating Margin

25
Walmart: 12th
Costco: 5th
in Net Margin
25/52
Enterprise Ranking - Return on Assets

26
Costco ranks the 1st, Walmart ranks the 11th on ROA.
26/52
KPI Examination - Standard KPI examination (Walmart)

27
Walmart's Current Ratio is lower than 1.
Walmart's Net Income Growth Rate is negative.
27/52
KPI Examination - Standard KPI examination (Costco)

28
Costco's operational efficiency metrics are better than Walmart's, contributing to Costco's higher profitability metrics than Walmart's.
28/52
Enterprise Comparison - Size

31
Walmart is larger than Costco in size
31/52
Enterprise Comparison - Profitability

32
Except for Gross Margin, Walmart’s profitability is lower than Costco
32/52
Enterprise Comparison - Profitability

33
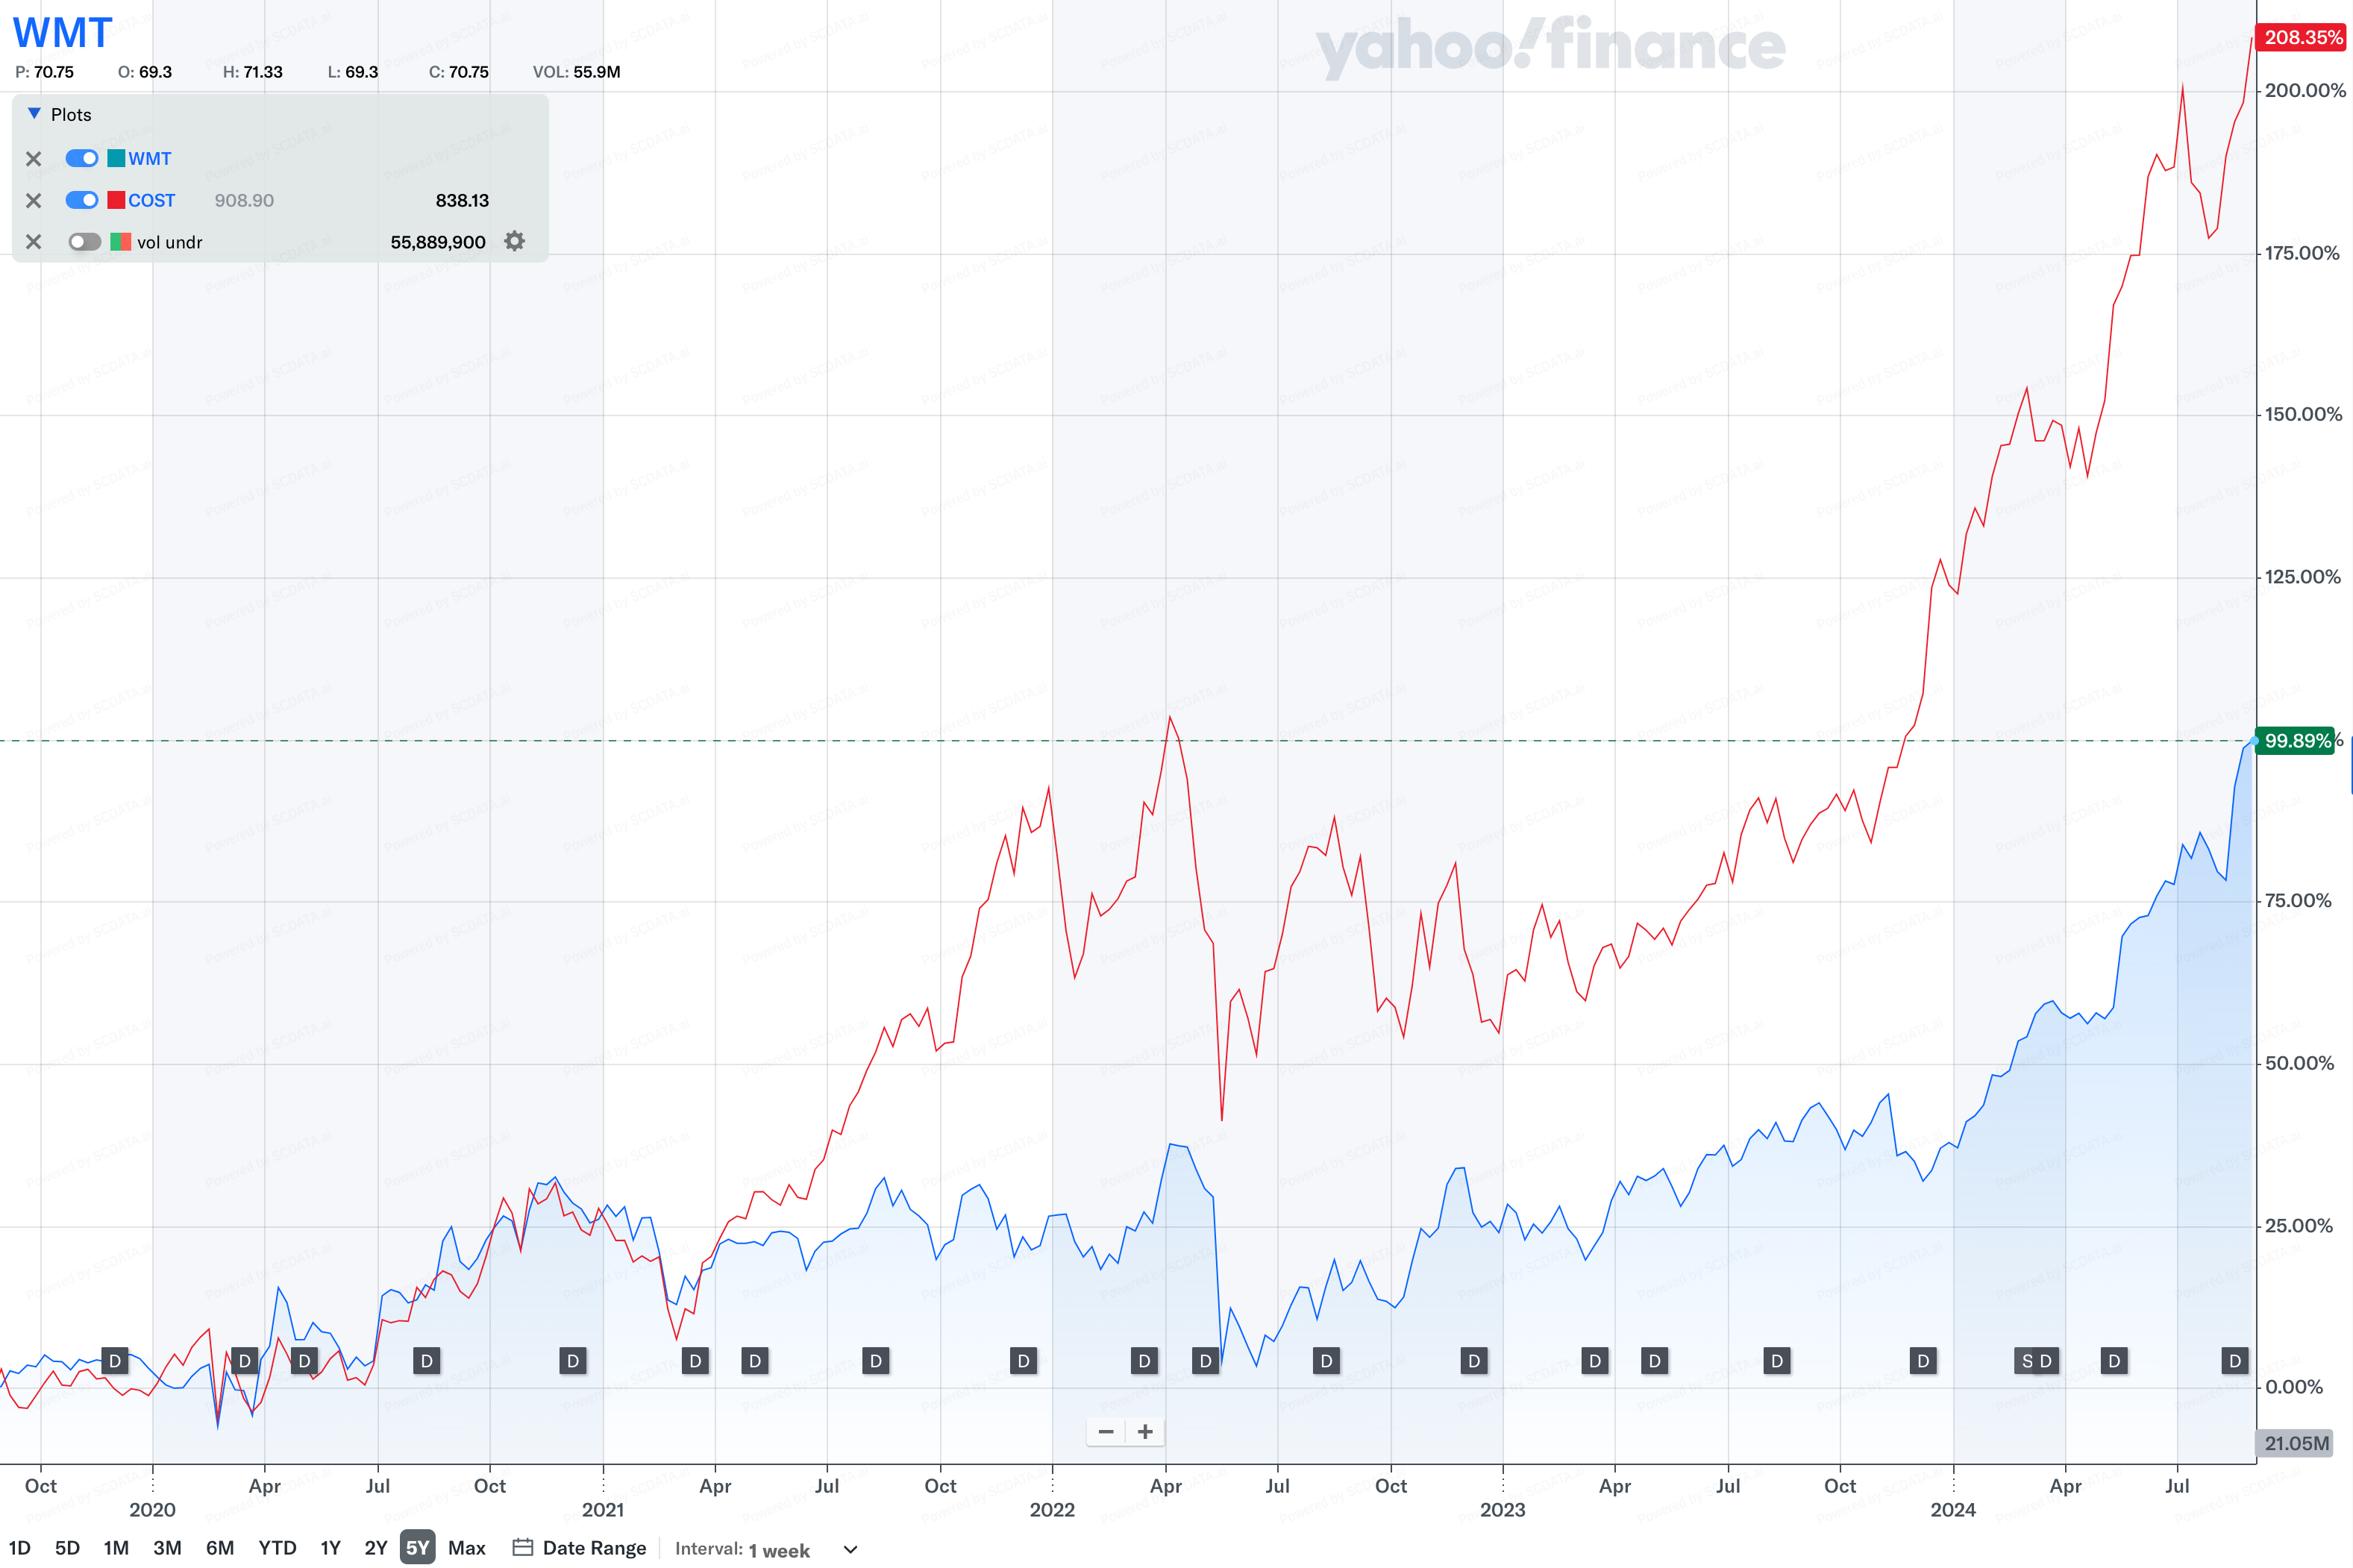
Walmart has lower investment returns than Costco – explains the two companies’ stock market performance difference.
33/52
Enterprise Comparison - Key Indicators

34
Walmart has better Gross Margin, but either equal or worse performance in almost all areas: profitability, growth, financial health and efficiency
34/52
Enterprise Trend - Size

37
Both companies’ revenues are increasing. Walmart’s profitability has been fluctuating, while Costco’s profitability has been steadily increasing.
37/52
Enterprise Trend - Profitability

38
Gross margin: Walmart and Costco have remain stable. However, Walmart has seen declines in operating margin, net margin, and ROA since 2016, while Costco has seen an increasing trend.
38/52
Enterprise Trend - Financial Health

39
Costco's current ratio (>1) indicates good short term financial health.
Costco's long-term debt has been lower than Walmart's, indicating Costco relies more on equity financing and has less long-term debt, indicating potentially lower financial risk.
39/52
Enterprise Trend - Growth

40
Walmart’s growth rates have been dominated by Costco’s since 2016 except the Net Income Growth Rate in 2020 and the Free Cash Flow Growth Rate. The growth rates are strong indicators of stock market performance.
40/52
Enterprise Breakdown - Revenue

43
Walmart’s COGS is lower than average, but has high SG&A cost.

Costco’s COGS is higher than average but is lower on other costs.
43/52
Enterprise Breakdown - Revenue

44
The two firms’ liability-equity ratios are similar.
The difference lies in Costco’s having a bigger portion of short-term liabilities, whereas Walmart has a bigger portion of long-term liabilities.
44/52
Enterprise Breakdown - Liability-Equity

45
Walmart has lower “Cash and Cash Equivalent” and higher “Property Plant and Equipment” than Costco.
45/52
Value Driver Analysis

46
Inventory turnover is negatively correlated with Gross margin.
Intuition: cheaper products sell faster
46/52
Value Driver Analysis

47
“SGAC/Total Revenue” is negatively correlated with “Inventory Turnover”.
Intuition: High operational efficiency means more efficient inventory management.
47/52
Value Driver Analysis

48
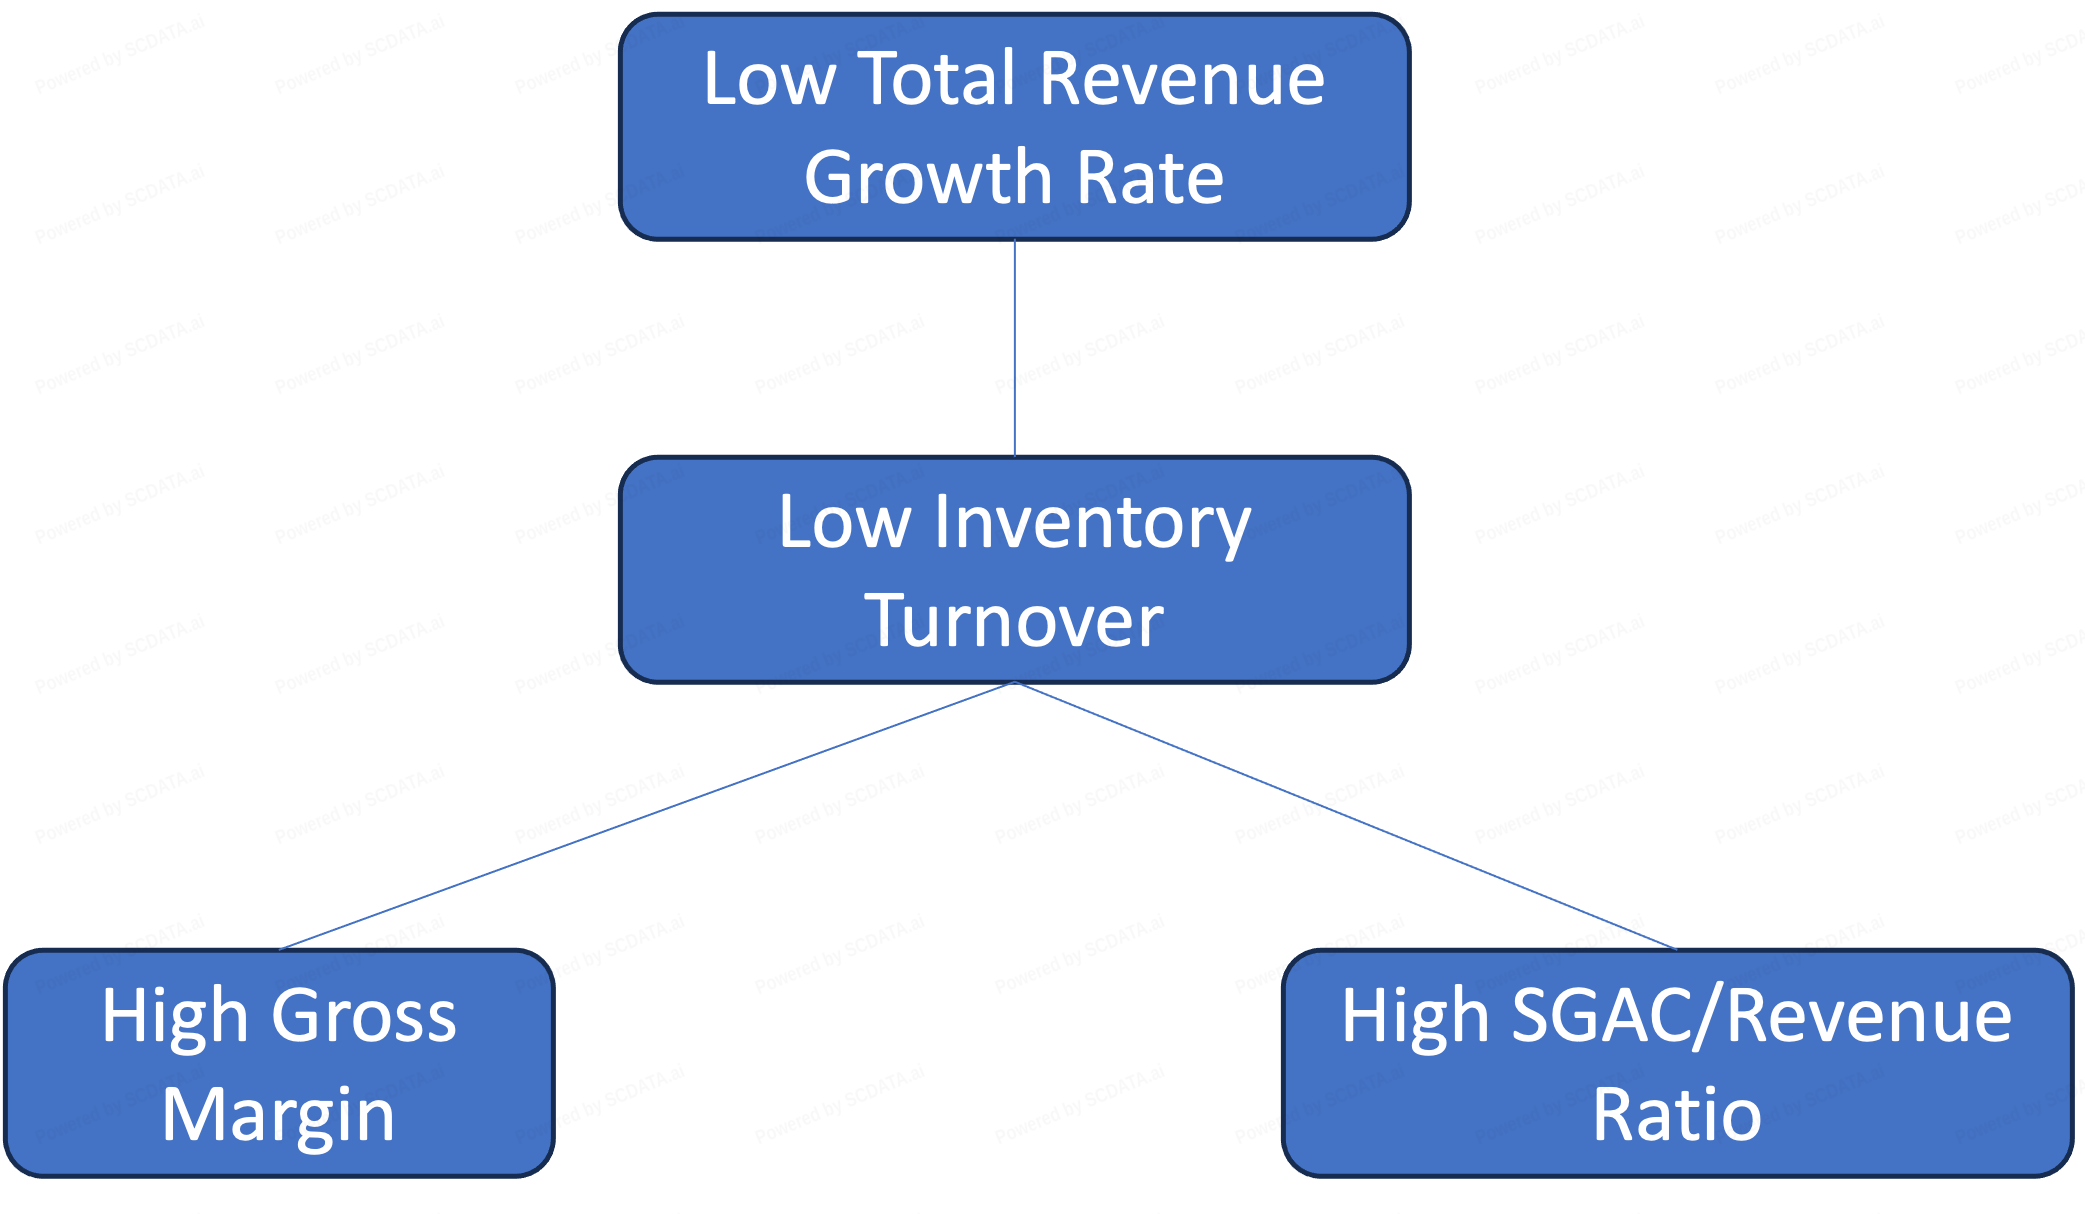
“Total Revenue Growth Rate” is negatively correlated with “Gross Margin”.
Intuition: Efficiency is higher for high-volume, low-margin businesses
48/52
Value Driver Analysis

49
“Total Revenue Growth Rate” is positively correlated with “Inventory Turnover”.
Intuition: Efficiency is higher for high-volume, low-margin businesses
49/52


