Abstract: The Indian healthcare industry is one of the fastest-growing sectors in the country, driven by the need for improved healthcare services, an expanding middle class, and increasing life expectancy. With a growing focus on providing affordable and accessible healthcare, India has seen substantial investments in both public and private healthcare infrastructure. The healthcare sector encompasses various segments, including hospitals, pharmaceuticals, medical devices, diagnostics, and health insurance.
Industry Analysis of the - Health Care sector ( India)
ARIJIT MUKHERJEE
STUDENT-PGCP ( MANIPAL ACADEMY OF HIGHER EDUCATION-INDIA)

Healthcare Sector India
The healthcare sector in India is currently undergoing significant growth, driven by government initiatives, increasing investment, and rising demand for quality healthcare.
The Indian healthcare sector is influenced by various key stakeholders and factors that shape its dynamics and growth. Here are the primary influencers:

Introduction
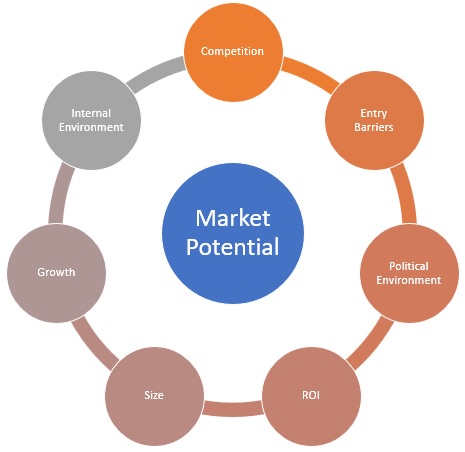

Abstract of Graphical analysis for Market potential, growth and profitability -Heath sector ( India)
Consumer Staples: Similar to Consumer Discretionary, this sector appears to have a good balance of inventory turnover and ROA/ROI, indicating efficient operations.
Energy: This sector shows relatively low inventory turnover and ROA/ROI, which could be due to the nature of the industry (long production cycles, high capital investment).
Financials: This sector typically has high ROA/ROI due to its leverage, but the inventory turnover is not applicable as it doesn't deal with physical inventory.
Health Care: This sector shows a mix of results, with some companies having high ROA/ROI and others having lower values. Inventory turnover may vary depending on the specific sub-sector (pharmaceuticals vs. medical devices).
Industrials: This sector generally has decent inventory turnover and ROA/ROI, indicating efficient operations.
Information Technology: This sector typically has high ROA/ROI, reflecting the high profitability of many tech companies. Inventory turnover is less relevant as it deals more with intellectual property.
Materials: This sector shows a mix of results, with some companies having high ROA/ROI and others having lower values. Inventory turnover can vary depending on the specific materials produced.
Real Estate: This sector typically has lower inventory turnover due to the long-term nature of real estate investments. ROA/ROI can vary depending on the property type and market conditions.
Telecommunication Services: This sector generally has high ROA/ROI, reflecting the stable cash flows and high barriers to entry. Inventory turnover is not applicable as it doesn't deal with physical inventory.
Utilities: This sector typically has stable cash flows and high ROA/ROI, but inventory turnover is not applicable.
Total Revenue and Operating Income -Information Technology (IT) and Health Care show significant contributions but at a lower scale than Energy and Financials.
Median Operating Margin-Health Care exhibits the highest median operating margin, reflecting its profitability, possibly due to innovation and higher R&D spending.Median Net Margin -Health Care again leads with the highest median net margin, indicating strong profitability after all expenses.

Abstract of Concentration and Competition Intensity - Within Health Care sector
The legend identifies major players like:

Sun Pharmaceutical Industries (orange)
Aurobindo Pharma Limited (green)
Dr. Reddy's Laboratories (light blue)
Cipla Limited (red)
Lupin Limited (blue)
The chart suggests:

The revenue share of companies has remained relatively consistent from 2018 to 2023.
The 2017 data seems unique—possibly representing only a subset of the companies (as most companies are absent).

The Indian pharmaceutical industry shown here is moderately concentrated with the top players holding significant market share.
Competition intensity is moderate, as smaller firms exist but struggle to challenge the dominance of the largest players.
Stability in revenue proportions implies a mature market with limited competitive disruptions over time.
1. Concentration
High concentration at the top:
A few large players—Sun Pharmaceutical Industries, Dr. Reddy's Laboratories, Cipla, and Aurobindo Pharma—consistently dominate a significant portion of the total revenue, as seen by their relatively large segments in the stacked bars across all years.
This suggests a concentrated market where the top players hold a larger share of the revenue pie.
The remaining companies are smaller and contribute incrementally to the total, indicating a long "tail" of smaller firms.
Steady concentration:
The relative revenue proportions for the major players remain stable from 2018 to 2023, signaling that the market share of top firms has not been eroded significantly.
2. Competition Intensity
Moderate competition:
While a few companies dominate, the presence of numerous smaller firms indicates moderate competition. Smaller players are actively competing for market share, but they are yet to make significant gains over the top firms.
Barriers to entry:
The stability in market share suggests that barriers to entry (like R&D costs, regulatory compliance, and scale of operations) prevent smaller players from disrupting the dominance of larger firms.
Slow market share redistribution:
The relatively unchanged size of segments year-over-year reflects low volatility in competitive dynamics. There’s no major player gaining or losing significant market share, which suggests a mature and stable competitive environment.


