Enterprise Ranking - Total Revenue

8
An overview on Technology industry for China, Europe, the USA, South Korea, and Japan in fiscal year 2023. Looking at the 20 largest, it's interesting to note that 15 of them are electronic materials-based companies and only five are electrical equipment or renewable energy and electronic focused.
Contemporary Amperex Technology Co (CATL) and LG Chem Ltd are in the top five companies in total revenue. However, LG Chem is much more diversified than CATL, because it is involved in Basic Materials & Chemicals, IT & Electronic Materials, and Energy Solutions.
8/54
Industrial Trend - Industry Total Size

9
Looking at the overview industrial trend, it is clearly that all of the EV battery manufacturers are not classified under one industry or sub industry, they are distributed across different industry eco system.
9/54
Operating Margin vs. Revenue

10
The chart with operating margin over a period of 2023 - is also quite interesting.
As it turns out, the EV battery industry (most of the largest manufacturers) noted a significant increase in the past three years. CATL is the lone leader with high operating margin during the period. No other manufacturer was able have this high operating margin, although as of new advancement in battery chemistry technology, LG Chem Ltd and BYD are already speculative.
10/54
Enterprise Distribution: Electronic materials and technologies 2023 Total Revenue

13
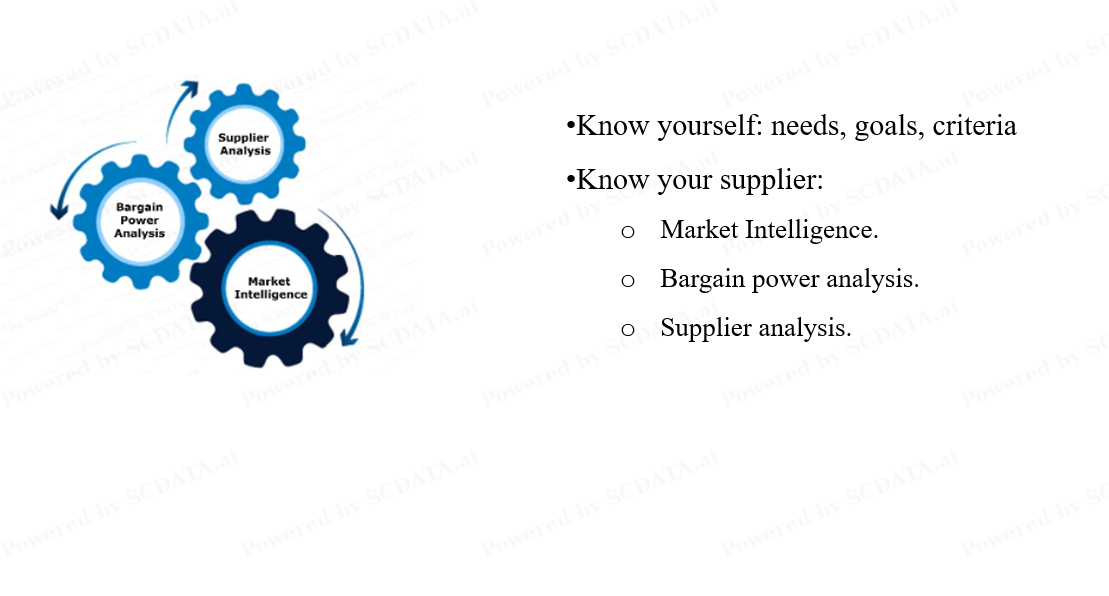
Objective: identify potential suppliers by analyzing the global supplying markets.
With business geographical information tesla is able to identify potential countries and suppliers globally. Using enterprise distribution, countries with the highest total revenue in electronic materials and technologies are China, Taiwan, US, South Korea and Japan
13/54
Enterprise Distribution: Electronic materials and technologies 2023 Total Revenue

14
From the bar chart, we can see more clearly the quantitative differences in the total revenue.
China is clearly leading the way in the electronic materials and Technologies sub industry, which is followed by Taiwan, US, Japan, and Korea.
14/54
Enterprise Distribution: Electronic materials and technologies 2023 Total Revenue Growth

15
In addition to total revenue, we also look at the revenue growth rate of the electronic materials and technologies industry by country. Generally speaking, larger countries typically grow slower. However, we can see that South Korea, one of largest countries in electronic materials and technologies industry, also had the highest growth rates.
NOTE: Tesla shall focus on 3 countries for electronic materials and technologies suppliers for Battery cell supplies that is Korea, China and Japan.
15/54
Industrial Trend - Industry Total Size

16
The trend analysis of the industry total size can compare the electronic materials and technologies industry among different countries for multiple years.
We can see that China constantly outperformed Japan and Korea in both revenue and profits. China also has a faster growth rate in both revenue and profits during the recent five years than Japan and Korea. Japan is on a rise, but Korea seems to be more fluctuated.
16/54
Concentration and Competition Intensity - Total Revenue

18
Now we focus on Market share analysis to see the competition intensity is it either competitive or monopolized, and the stability of the major players in the electronic materials and technologies industry.
The concentration and competition intensity analysis of this industry shows that its rapidly consolidated in a few key regions, each vying for supremacy as global demand climbs that said the overall market shares are stable, and the market is relatively competitive with a few whales and many smaller fish. The major players are Contemporary Amperex Technology Co (CATL) China, LG Energy solution Ltd South Korea, Samsung SDI Co Ltd South Korea and BYD China.
China dominates, producing nearly 80% of lithium-ion batteries, thanks to its control over the supply chain. Meanwhile, Japan is racing to bolster their own manufacturing capabilities. South Korea also emerges as a significant player, benefiting from robust federal support:
18/54
Concentration and Competition Intensity - Four-firm Concentration Ratio

19
Before we interpret the analysis let it be clear that two players were left out due to difference in sub industry (Panasonic under consumer electronics and BYD under IT electronic components) the rest of the player are under one sub industry sector. The four-firm concentration ratio shows that the top four Electrical materials and technology companies account for some 90 percent of the market share. It is more concentrated geographically, but its is not a monopoly or a duopoly market, but it has quite some choices out there.
19/54
Concentration and Competition Intensity - Operating Income or Loss

20
Before we interpret the analysis let it be clear that two players were left out due to difference in sub industry (Panasonic under consumer electronics and BYD under IT electronic components) the rest of the player are under one sub industry sector. The net income analysis shows a different picture. While Contemporary Amperex Technology CO Ltd made a stable net income over the past few years, Samsung SDI Co Ltd is quite fluctuated in net income and indeed LG Energy Solution`s net income was negative in 2020.
Later after 2020 Samsung SDI and LG Energy's net income gradually increased. Subsequently Contemporary Amperex Technology CO Ltd continued to make a huge net income following years, which gradually increased in 2023.
20/54
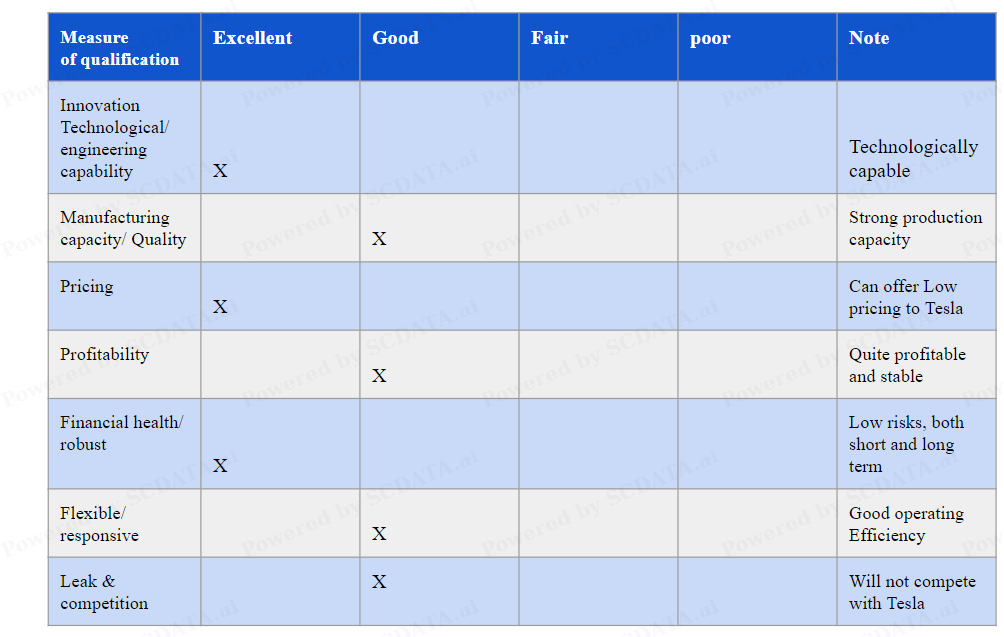
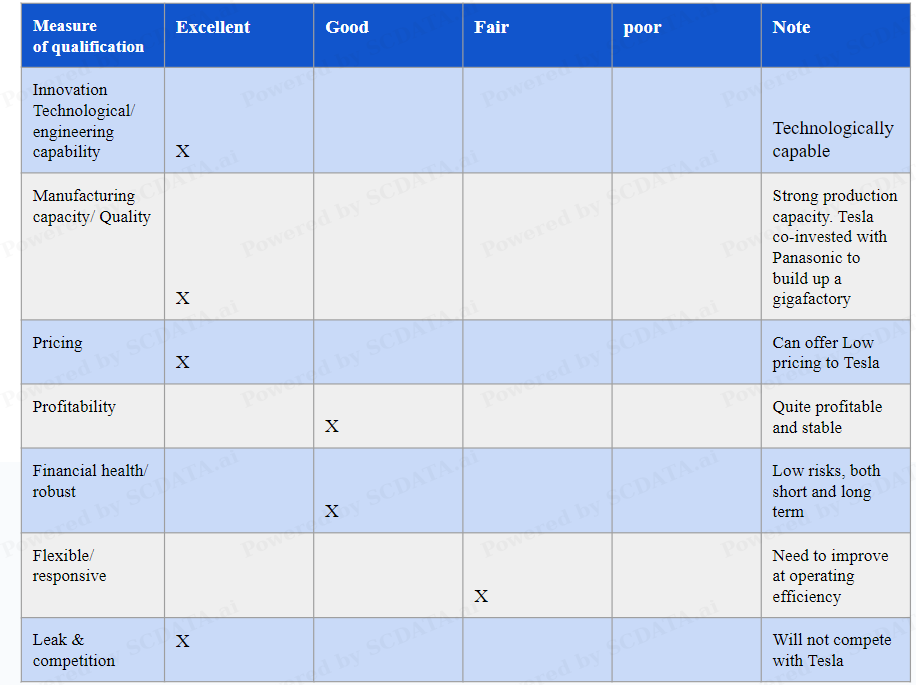
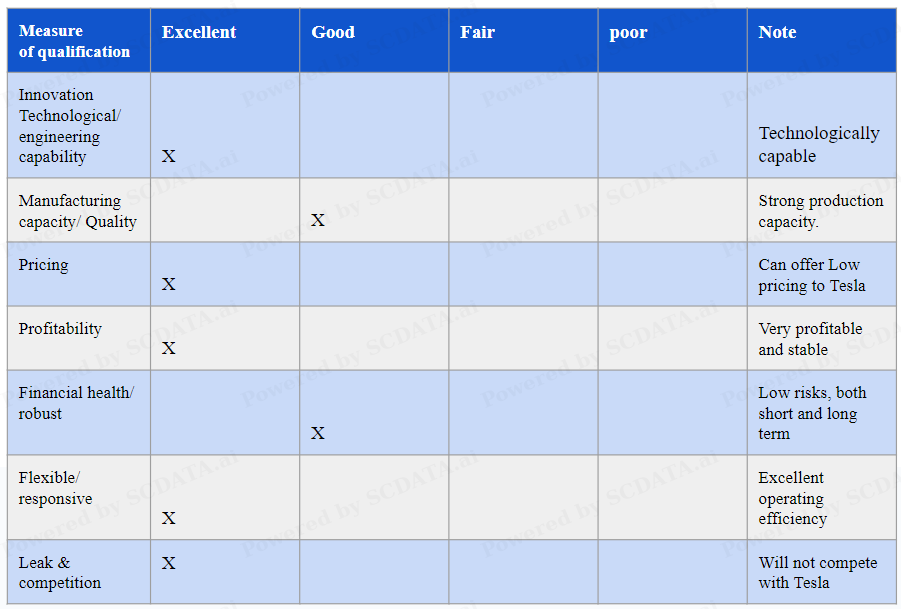
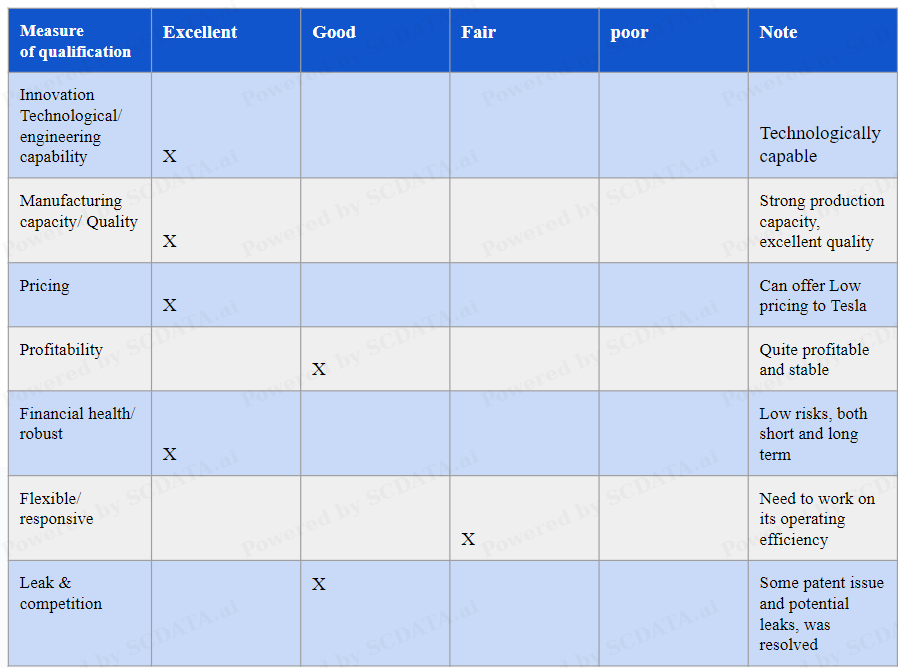
Enterprise Ranking - Total Revenue

21
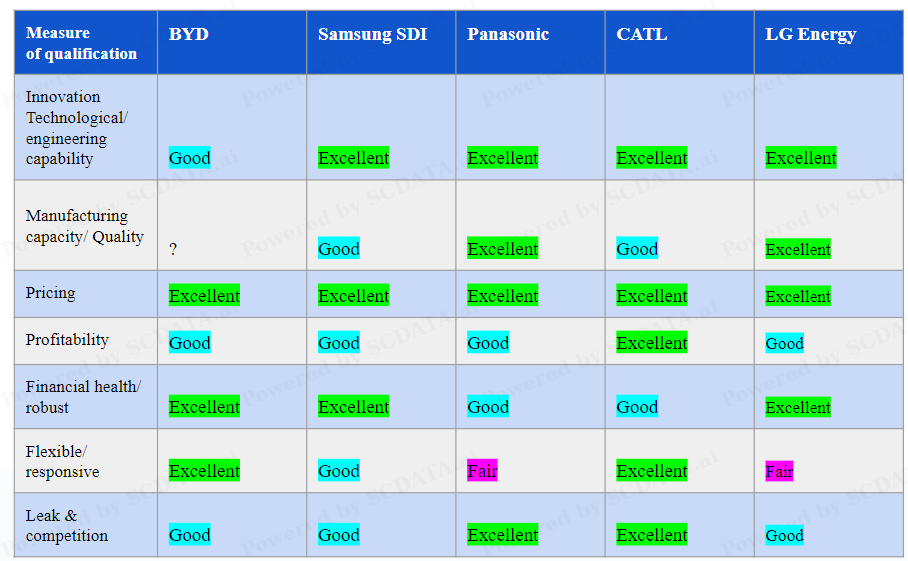
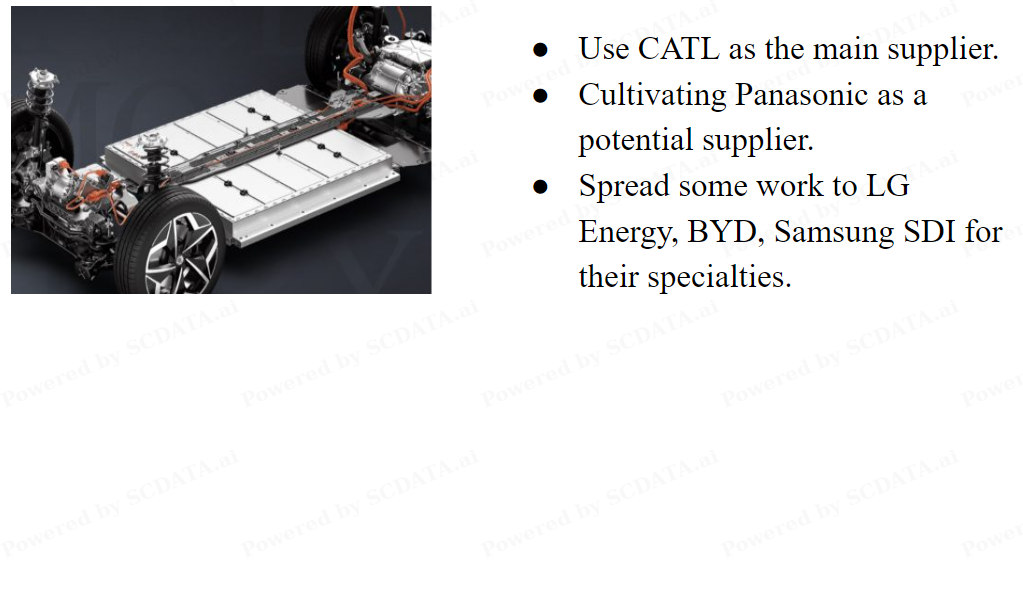
Following these analyses, we can pick a few potential suppliers for Battery cells from the enterprise ranking of the publicly traded Electrical materials and technology companies in China, South Korea, and Japan.
For this case, Panasonic Holding Corporation, Contemporary Amperex Technology Co (CATL), LG Energy Solution Ltd, BYD Electronic International are picked because of their size. Samsung SDI Co Ltd is picked to enhance supplier diversity.
21/54
Enterprise Trend - Size

24
we can see that Panasonic Holdings constantly outperformed Samsung SDI, BYD, CATL and LG Energy in both revenue and operating income not until 2020, it's understandable because Panasonic is diversified. CATL`s operating income is on the rise in 2020 surpassing Panasonic, LG Energy`s operating income is negative in 2020, but we see its revenue is on the rise gradually that same year. The rest of the companies seemed to be stable and relative competitive
24/54
Enterprise Comparison - Size

27
We look at BYD, CATL, LG Energy, Panasonic and Samsung SDI. In fiscal year 2023, Panasonic has the highest total revenue and highest gross profit than the rest of the group but is low on other metrics than CATL. CATL is bigger in Dollar value than LG Energy, which is bigger than Samsung SDI and bigger than BYD.
27/54
Enterprise Comparison - Profitability

28
The profit margins in fiscal year 2023. It's clear that BYD is less profitable in all margins than the rest of group. Looking carefully at the rest of the group that is CATL, Samsung SDI, LG Energy and Panasonic. we can see Panasonic is highest on gross margin but lowest operating and net margin. LG Energy is less profitable in all margins compared to CATL and Samsung SDI. Samsung SDI is in between. CATL has the highest all margins.
28/54
Enterprise Breakdown - Revenue

29
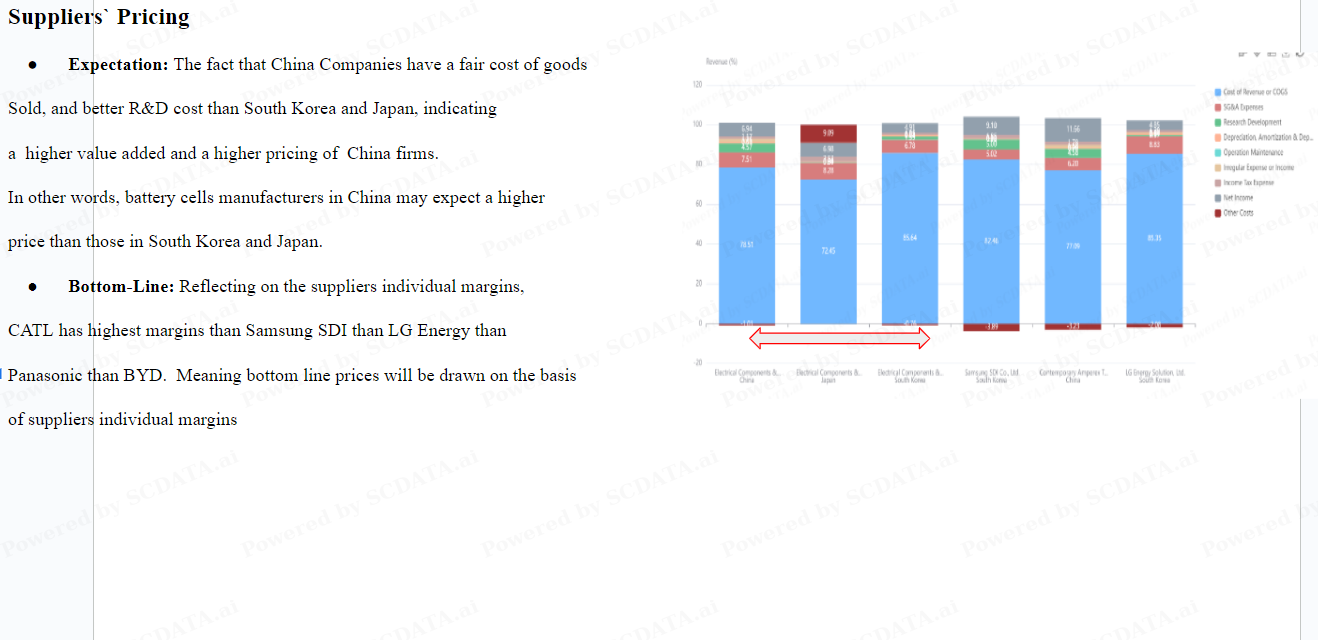
Before we interpret the analysis let it be clear that two players were left out due to difference in sub industry (Panasonic under consumer electronics and BYD under IT electronic components) the rest of the player are under one sub industry sector. The revenue breakdown analysis of 2023 Electrical components and equipment sub industry for China, Japan and South Korea shows more details.
Under the Enterprises lens it's clear that CATL has a fair control of COGS compared to the rest and its R&D is quite better and it made more dollars than LG Energy.  Samsung SDI likewise is better at COGS than LG Energy and leads at R&D than both of other enterprises and it made some dollars too than LG Energy. LG Energy has the highest COGS among the three, lowest pricing, spends less on R&D and it needs to work on its SG&A expenses
29/54
Enterprise Trend - Profitability

31
The observation drawn earlier are consistent over time. CATL`s profit margins are stable and increasing. it's becoming more competitive. Panasonic has the highest gross margin, but lower operating margin and net margin also consistent over time. Samsung SDI has a balance across its margins and comparable gross margin as CATL and competitive.
Finally, LG Energy started off with increasing gros margin in 2020 when it decided to spin off its battery business to cope with growing demand from global automotive manufacturers. LG Chem's battery business officially became a separate company and changed its name to LG Energy Solution Ltd. in 2020. It subsequently undertook an IPO process to secure funds in order to increase its battery production capacity. we have seen its operating income and net margin to be stable and increasing.
BYD has lowest gross margin for three consecutive years and has comparable operating margin and net margin as LG Energy and Panasonic but less stable
31/54
Enterprise Comparison - Profitability

34
let's look at the financial indicators of the battery cell suppliers to Tesla, considering current ratio and quick ratio (short-term risk), liability asset ratio (long-term risk) and operating cash net income ratio (cash flow from operating activities per $ of net income). Notably a few of them look health in short- term that is CATL and LG Energy because they current / quick ratio is greater than 1. BYD, Samsung SDI and Panasonic have current ratio greater than 1 but quick ratio less than 1. They all look healthy in long-term because their liability asset ratio < 1 (inverse > 1). All made good cash flow from operations as the operating cash net income ratio > 1. Cash flow from operations is preferred to investment and financing because there is less room to manipulate the results through accounting tricks
34/54
Enterprise Breakdown - Liability Vs Equity

36
Before we interpret the breakdown let it be noted that two players were left out due to difference in sub industry (Panasonic under consumer electronics and BYD under IT electronic components) the rest of the player are under one sub industry sector. The Liability-Equity breakdown analysis of 2023 Electrical components and equipment sub industry for China and South Korea shows more details.
Samsung SDI has the highest percentage of equity and lowest percentage of total liabilities.
Contemporary Amperex Technology Ltd has significantly more non-current liabilities than other suppliers. LG Energy Solution Ltd is very healthy on equity and liabilities with equity being more than 50% of the total assets.
36/54
Enterprise Breakdown - Detailed Assets

37
Before we interpret the breakdown let it be noted that two players were left out due to difference in sub industry (Panasonic under consumer electronics and BYD under IT electronic components) the rest of the player are under one sub industry sector.
 Breaking down their assets into details. we find that Contemporary Amperex Technology Ltd has the highest cash and surprisingly low property, plant and equipment, putting its production capacity and responsiveness at question. LG Energy Solution Ltd is second in cash and has largest property and equipment which implies high production capacity and responsiveness.
Samsung SDI has a second largest property which means a decent production capacity, but may ran a little low on cash.
37/54
Enterprise Trend - Financial Health

38
The tread analysis reveals these companies' financial health over time. we observe that over the recent years, BYD, Samsung SDI have little short/ long term risks and thus excellent financial health and stability. While Contemporary Amperex Technology Ltd, LG Energy and Panasonic they are fine on short-term risk, their liabilities asset ratio and long-term debt ratio up swing quite significantly in recent years almost to danger zone in 2021, the good news is that after 2021, the situation became less severe for Panasonic and LG Energy. On the other side after 2021 we see BYD liabilities asset ratio and long-term debt ratio gradually increase.
38/54
Enterprise Comparison - Efficiency

42
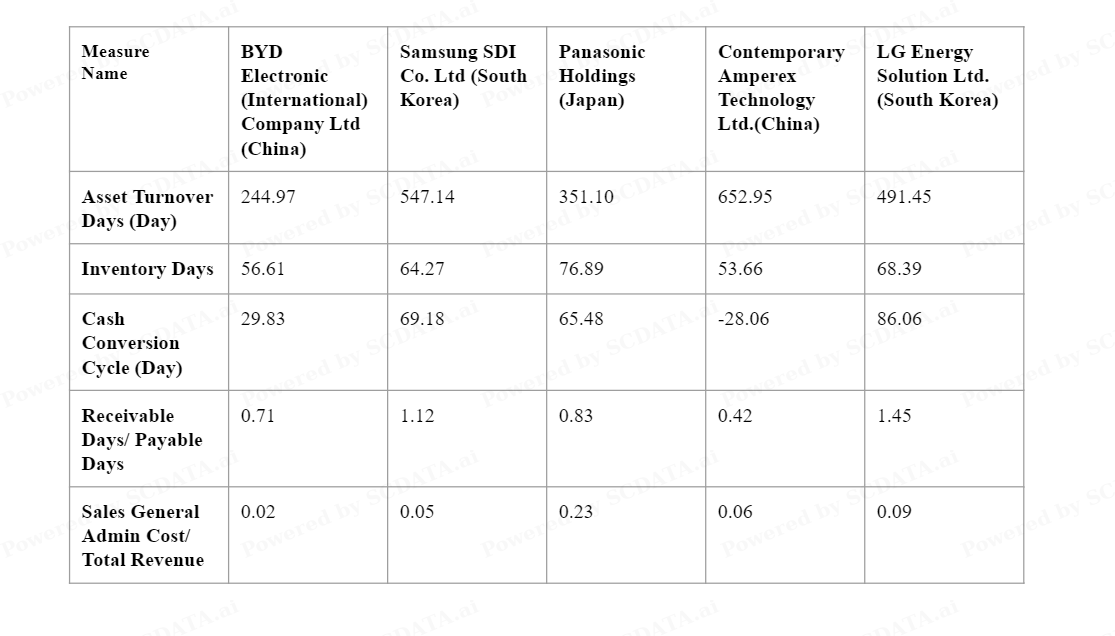
An enterprise comparison on efficiency among the potential suppliers for battery cells of Tesla shows that asset utilization wise, Samsung SDI and LG Energy Solution Ltd are heavier on asset than Panasonic Holding and BYD but lighter than CATL. Inventory wise, CATL best, BYD and Samsung SDI better, LG Energy and Panasonic need to improve. Cash cycle, CATL best. CATL is strong as reflected by receivable days is 42% of payable days ~ BYD. LG Energy is the weakest. SGA Cost efficiency, BYD is the most efficient, CATL, Samsung SDI and LG Energy better, Panasonic the least
42/54
Enterprise Trend - Efficiency

44
looking at the trend over time, inventory days are stable for all players and consistent. Cash cycle: CATL is best, BYD, Panasonic, Samsung SDI and LG Energy are stable but need to improve. Payable days over receivable days are increasing for CATL indicating a buildup on market / negotiation power. BYD and Panasonic are stable, Samsung SDI and LG Energy their market / negotiation power is weak
44/54