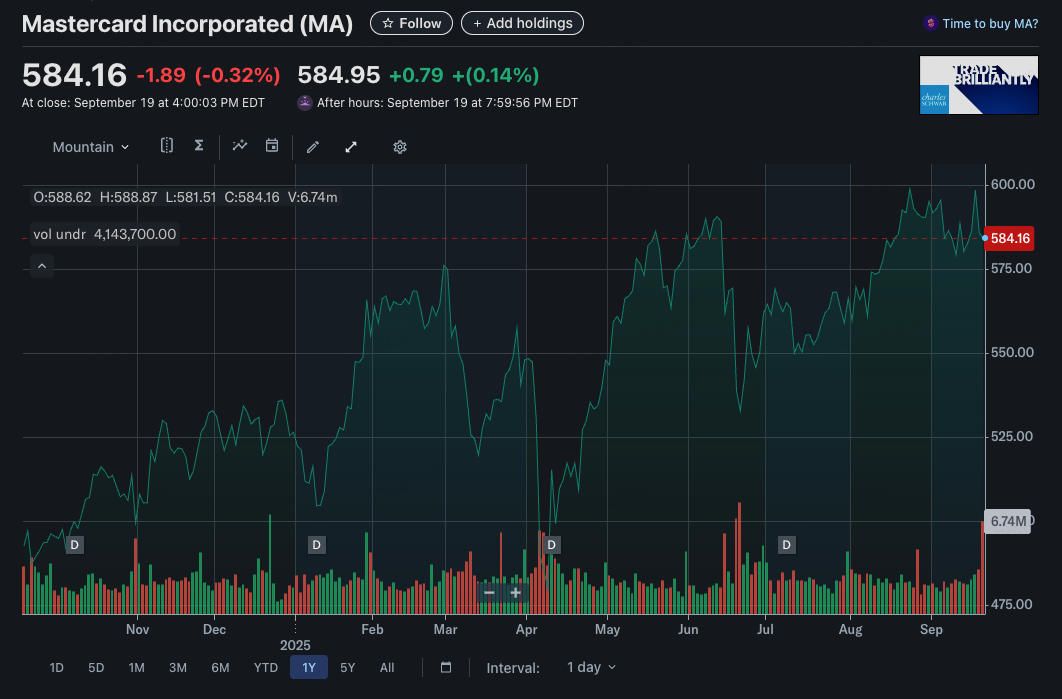
Mastercards Industry Classification: Information Technology/Software & Services/IT Services/ Data Processing & Outsourced Services

9
Master Card falls in the Data
9/62
Mastercard is interesting as they are financial institution that falls under the data processing and outsourced services sub-industy and is specifically referred to as a diversified bank (financial institution )

10
Mastercard is interesting as they are financial institution that falls under the data processing and outsourced services sub-industy and is specifically referred to as a diversified bank (financial institution )
10/62
Enterprise Distribution of Firms in the IT Services Industry in the US

11
There are approximately 94 enterprise IT service firms within the US
26 of these are located in California and New York (Followed by 9 in Virginia)
11/62
Total Revenue from IT Service Firms in the US

12
The cities with the most firms drive the most revenue, with New York leading with a total annual revenue of $122113.71(M), followed by California, and New Jersey respectively.

There is a clear bifurcation between the two mega-markets (NY/CA) vs. everyone else under $45B
Texas (~$20B) as #3 is less than 20% of New York's revenue - shows how concentrated the payment processing industry really is
12/62
Typical Firm Performance by Region - Profit Distribution for the IT Services Industry

13
Wisconsin dominates with $20B median revenue and massively outperforms traditional financial centers like New York ($900M).
New York/California show surprisingly low median revenues despite being payment epicenters
This shows that less competition in secondary markets allows higher per-firm performance
13/62
Enterprise Distribution of Firms in the same industry as Mastercard (Data Processing and Outsourced Services)

14
On drilling down to firms in the same industry as Mastercard, California and New York predictably lead with 11 and 10 competitors respectively, but its interesting how Colorado, Utah, and Georgia have emerged as secondary fintech hubs with 5+ firms each.

Texas shows a massive opportunity gap with only 2 competitors despite being the second-largest economy, while large portions of the South and Midwest remain competitive deserts.

The East Coast shows intense saturation from Massachusetts to Georgia, suggesting this corridor represents Mastercard's most contested battleground. Meanwhile, the concentration pattern suggests regulatory environments and infrastructure availability matter more than market size for where payment processors choose to establish operations.
14/62
Concentration and Competition Intensity - Operating Income or Loss

18
Total operating income nearly doubled from ~45K in 2016 to ~90K+ in 2024, showing the payment processing boom benefiting everyone

Pink sections expanding dramatically, especially post-2020, suggesting Visa converts revenue leadership into even stronger profit margins

Sharp drop during pandemic year before explosive recovery shows how transaction-dependent this industry really is
18/62
Industrial Trend - Industry Total Size

21
California grew IT Services revenue from $30B (2016) → $95B (2024), closing the gap with New York at $120B → $125B.

California’s operating income rose from $10B (2016) → $31B (2024), overtaking New York’s $20B → $30B by 2021.

California net income nearly quadrupled (from $6B to $25B), outpacing New York’s slower climb from $16B → $21B.

New York sustained 50–60% of firms profitable, vs. California’s dip to 25% in 2020–22, before rebounding to 50% in 2024.

California = high-growth, volatile disruptors; New York = mature, stable incumbents
21/62
Industrial Trend - Profitability

22
California companies maintain higher gross margins (~45–50%) compared to New York (~30–35%), showing stronger top-line profitability.

Despite this, California has faced sharp operating and net margin declines, hitting lows of –25% operating margin and –40% net margin in 2022–23.

New York has remained consistently stable, with operating, net, and pre-tax margins hovering around 0–5% throughout 2016–2024.

Profit before tax margins in California show deep troughs (as low as –45% in 2023) versus New York’s flat-to-slightly-positive trajectory.

A sharp rebound in 2024 lifted California margins back toward breakeven across operating, net, and pre-tax levels, suggesting potential recovery after years of losses.
22/62
Industrial Trend - Efficiency

23
California held inventory lean at 5–11 days (2020–24) versus New York’s spike to 51 days in 2022 and still high at 39 days in 2024, showing stronger working capital discipline.

California shortened its cash conversion cycle from –223 days in 2017 to around 0 days from 2019 onward, while New York stayed positive at 3–26 days, indicating slower cash efficiency.

New York sustained higher asset productivity, with turnover at 1.29 in 2017 and ~0.5 in 2024, plus ROA positive at 0.05 in 2016 → 0.02 in 2024. California lagged with lower turnover (0.3–0.6) and negative ROA down to –0.13 in 2023, only rebounding to 0.01 in 2024.
23/62
Industrial Trend - Financial Health

24
California IT firms maintained stronger liquidity with a current ratio of 1.2–1.7 (2016–24), compared to New York’s IT firms tighter range of 1.0–1.3, showing greater short-term flexibility.

Liability-to-asset ratios were broadly similar, with both states moving between 0.6–0.8, though California IT firms spiked to 0.85 in 2020 before falling back to 0.65 in 2024.

California’s IT firms operating cash flow was unusually high in 2016 (~$500M), collapsed near zero in 2017–22, and only modestly recovered to ~$40M in 2024. New York IT firms stayed flat near zero until a surge in 2023–24 (up to ~$180M).

Cash balances were higher in California IT firms throughout, starting at ~$1B in 2016, dipping, and then rising steadily to ~$350M in 2024, while New York IT firms climbed more gradually to ~$150M in 2024.
24/62
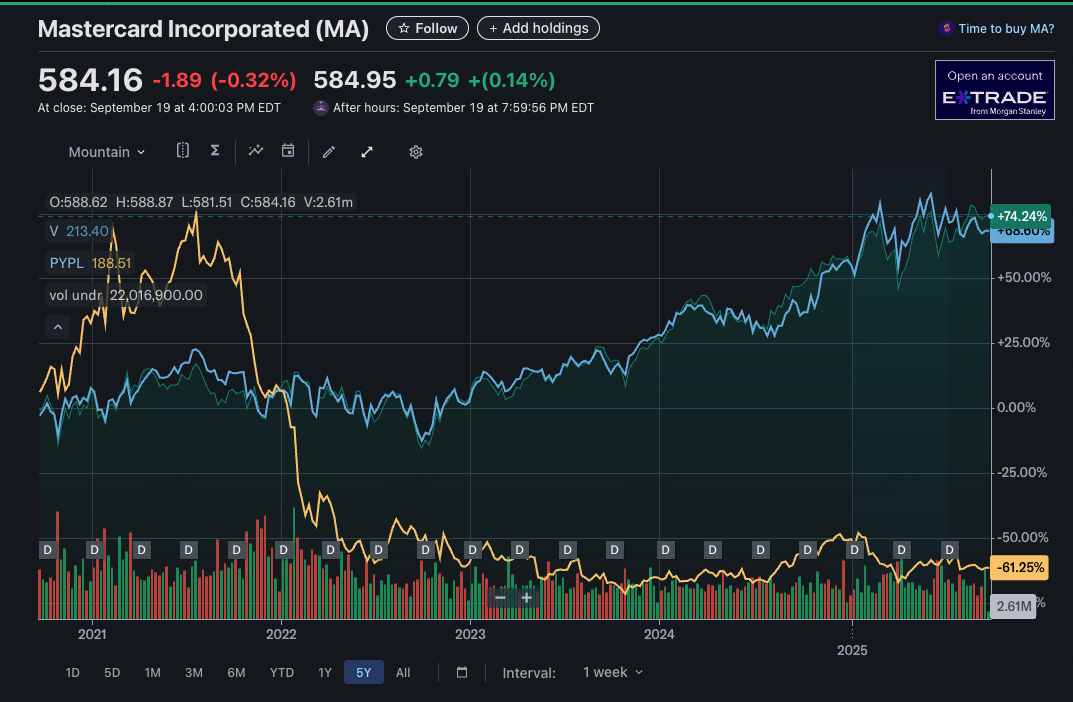
Revenue vs. Cost

27
Visa and Mastercard both outperform the cost–revenue trendline, showing structurally higher efficiency than peers.

Mastercard achieves similar revenue to PayPal with nearly 50% lower cost, highlighting far stronger operating leverage.

PayPal still scales well above average firms but lags Visa/Mastercard in efficiency, signaling margin pressure.
27/62
Profit vs. Cost - Gross Profit

28
Visa and Mastercard both generate far higher gross profit relative to cost than the industry trend, signaling superior efficiency.

PayPal delivers strong gross profit in absolute terms but sits closer to the cost line, indicating weaker efficiency compared to Visa/Mastercard.

Visa leads the pack with the highest gross profit margins, Mastercard follows closely, while PayPal lags despite high scale.
28/62
Profit vs. Cost - Operating Income

29
Visa achieves the highest operating income (~$23B) at comparable cost levels, leading the industry in efficiency.

Mastercard follows with ~$17B operating income, also far above the cost–profit trendline, showing strong leverage.

PayPal underperforms, generating only ~$7B operating income despite similar costs to Visa/Mastercard — clear efficiency gap.
29/62
Operating Margin vs. Revenue

30
Visa delivers the strongest operating margins at high revenue scale, reinforcing its efficiency advantage.

PayPal also achieves solid margins but at lower revenue, signaling profitability but less leverage than Visa.

Mastercard appears with comparable revenue but thinner margins, showing that scale alone doesn’t guarantee efficiency.

The broader industry clusters near breakeven, highlighting that Visa and PayPal operate far above the sector norm.
30/62
Return on Assets vs. Liability Asset Ratio

31
Most leading firms cluster in the top-left quadrant with positive ROA (~0–2%) and low leverage (liability/asset ratio <1.0), showing balanced financial health.

Outliers like VRTC (–8% ROA, ~70 leverage) and IPSI (–11% ROA, ~30 leverage) reflect firms with high debt loads and poor returns, clear signs of financial stress.

Overall, the industry shows a split between efficient, low-leverage leaders and highly stressed, over-leveraged laggards including mastercard
31/62
Enterprise Ranking - Total Revenue

34
Visa leads the industry with the highest revenue, followed closely by PayPal.

Mastercard ranks #3, slightly behind PayPal in scale but ahead of all other competitors.

The top 3 (Visa, PayPal, Mastercard) form a clear revenue tier, each generating materially more than the rest of the industry.

Mastercard competes directly with Visa and PayPal at the top of the table, far above mid-tier players like Block, Fiserv, and ADP.
34/62
Enterprise Ranking - Operating Margin

35
Visa ranks #2 in the entire industry on operating margin, confirming its ability to convert scale into strong profitability.

Mastercard is close behind at #3, with margins only slightly lower than Visa — showing near-equal efficiency.

PayPal lags at #15, far down the ranking, highlighting a significant gap in profitability compared to Visa and Mastercard despite its revenue scale.

The contrast underscores that while PayPal competes on size, Visa and Mastercard dominate on margin strength, putting them ahead in sustainable profitability.
35/62
Enterprise Ranking - Return on Assets

36
Mastercard ranks #1 in the entire industry on return on assets, showing it generates the strongest returns from its asset base.

Visa follows at #5, also delivering high ROA, confirming its efficiency in asset utilization but still trailing Mastercard’s superior performance.

PayPal does not appear in the top 20, underscoring its weaker efficiency compared to Visa and Mastercard despite its revenue scale.

This reinforces the competitive gap: Mastercard and Visa lead on both profitability and asset efficiency, while PayPal struggles to convert scale into strong returns.
36/62
KPI Examination - Standard KPI examination (Mastercard)

37
Profitability is exceptional: Gross margin 76%, operating margin 58%, and net margin 46% all place Mastercard in the top percentile of the industry. ROA (27%) and ROIC (55%) confirm it is the most asset- and capital-efficient player.

Financial health is solid: Free cash flow to cost is strong (1.15x), liability/asset ratio is healthy (0.86), though liquidity is average with a current ratio near 1.0.

Growth is steady, not explosive: Revenue growth (12%) and net income growth (15%) are around industry median — Mastercard wins more on efficiency than raw expansion.

Operational discipline: SG&A intensity is lean (15% of revenue), inventory is negligible (<1 day), and cash conversion cycle is negative (–1.9 days), reflecting strong working capital efficiency.
Overall: Mastercard is a profitability and efficiency leader with best-in-class returns, robust balance sheet, and disciplined operations, its competitive edge comes from efficiency and returns rather than top-line growth.
37/62
KPI Examination - Standard KPI examination (Visa)

38
Gross margin is extremely strong at 80%, with operating margin 67% and net margin 55%, placing Visa among the most profitable firms in the industry.

Return on assets (21%) and return on invested capital (34%) confirm high efficiency, though slightly below Mastercard’s best-in-class levels.

Financial health is excellent with free cash flow to cost at 1.57x, a stronger liquidity position than Mastercard (current ratio 1.28 vs. ~1.0), and a lower liability ratio (0.59).

Growth is steady with revenue up 10% and net income up 14%, broadly in line with Mastercard, but free cash flow growth dipped negative (–5%).

Operational discipline is lean, with SG&A only 10% of revenue, and inventory days negligible at <1 month. Cash conversion cycle is positive at 1.2 days, less efficient than Mastercard’s negative cycle but still healthy.
38/62
KPI Examination - Standard KPI examination (Paypal)

39
Gross margin (46%) is well below Visa (80%) and Mastercard (76%), and operating margin (18%) plus net margin (13%) trail far behind the leaders.

Return on assets (5%) and return on invested capital (15%) are weak, showing limited efficiency compared to Visa and Mastercard.

Financial health is adequate with current ratio 1.26 and liability/asset ratio 0.75, but free cash flow to cost is only 0.26x, far below peers.

Growth is mixed: revenue grew 7%, operating income rose 17%, but net income shrank (–2%). Free cash flow growth was high (60%), though from a low base.

Operational efficiency is uneven — SG&A at 13% of revenue is heavier than Visa/Mastercard, and the cash conversion cycle is highly negative (–406 days), reflecting distortions in working capital.
Overall: PayPal is large in revenue scale but structurally weaker in profitability and efficiency, leaving it at a clear disadvantage versus Visa and Mastercard.
39/62
Enterprise Comparison - Size

43
Visa dominates across all size metrics, leading in revenue, profit, and margins.

Mastercard is smaller in scale but holds a solid middle ground, especially strong in profitability relative to its size.

PayPal lags both peers on profit and income, showing weaker conversion of revenue into bottom-line results.
43/62
Enterprise Comparison - Profitability

44
Visa leads with the highest gross and net margins, showing superior profitability.

Mastercard is close behind, with stronger ROA than Visa, highlighting efficiency.

PayPal trails significantly on all profitability metrics, reflecting weaker margin control.
44/62
Enterprise Comparison - ROI

45
Mastercard clearly outperforms on all ROI metrics (ROE, ROA, ROIC), signaling it is extracting more value from every dollar of capital than both Visa and PayPal.

Visa is strong but trails Mastercard, suggesting operational and capital efficiency is good but not best-in-class.

PayPal underperforms across the board, highlighting structural inefficiency in turning capital into shareholder returns.
45/62
Enterprise Comparison - Size

46
Mastercard delivers strong balance of profitability and efficiency with net margin 46%, ROA 0.27, and ROE 1.98, outpacing both peers in capital returns.

Visa leads on scale and profitability with the highest net margin 55% and gross margin 80%, reinforcing its dominance.

PayPal underperforms on profitability (net margin 13%, ROA 0.05), highlighting structural inefficiency despite decent liquidity (current ratio 1.26).

Growth rates show Mastercard (12%) slightly ahead of Visa (10%) and PayPal (7%), giving it a modest momentum edge.
46/62
Enterprise Trend - Size

49
Mastercard revenue grew from $10.8B → $28.2B, strong momentum but still behind Visa ($15.1B → $35.9B).

Operating income rose to $16.3B, but Visa expanded faster to $24.1B; PayPal is much smaller at $5.7B.

Net income doubled to $12.9B, but Visa dominates at $19.7B, highlighting Mastercard’s smaller scale.
Mastercard shows strong growth, but Visa is the clear scale leader, while PayPal trails both
49/62
Enterprise Trend - Profitability

50
Gross margin: Mastercard steady at ~76%, just under Visa (80%), far above PayPal (46%).

Operating margin: Mastercard 58%, well below Visa (67%) but far stronger than PayPal (18%).

Net margin: Mastercard stable at 44–46%, slightly weaker than Visa (55%) but multiples stronger than PayPal (13%).

ROA: Mastercard leads peers with 0.27, outperforming Visa (0.21) and PayPal (0.05).
Mastercard is highly efficient and profitable, though Visa maintains margin leadership. PayPal remains structurally disadvantaged.
50/62
Enterprise Trend - Financial Health

51
Current Ratio: Mastercard declined from 1.52 → 1.03, now below Visa (1.26) and PayPal (1.28), showing thinner liquidity buffers.

Liability/Asset Ratio: Mastercard rose from 0.70 → 0.86, highest of the three, indicating heavier leverage vs Visa (0.59) and PayPal (0.75).

Long-Term Debt Ratio: Mastercard increased to 0.36, higher than Visa (0.22) and PayPal (0.12), showing greater reliance on long-term debt.

Financial Leverage: Mastercard climbed sharply from 4.6 → 7.4, while Visa is stable around 2.4 and PayPal around 3.9–4.0, making Mastercard the most debt-leveraged player.
Mastercard is strong in profitability but financially riskier: liquidity is thinner and leverage is materially higher than Visa and PayPal.
51/62
Enterprise Trend - Growth

52
Mastercard averaged 10–22% YoY through most years, slightly stronger than Visa (8–18%) but below PayPal’s peaks (20%+ in strong years). Mastercard’s growth steadied post-2021 at ~10–12%.

Mastercard hit highs of +42% (2017) and maintained healthy double-digit growth in most years, though PayPal showed greater volatility (big swings from +25% to -16%). Visa has been steadier at ~10–20%.

Mastercard delivered consistent, positive growth (except -21% in 2020), with recovery to +15% (2023). Visa is steadier but lower, while PayPal is erratic — from +71% (2020) to -42% (2022).

Mastercard has been stable (~10–30% in most years), outperforming Visa post-2021, while PayPal is highly volatile (spikes to +150% in 2018, crashes thereafter).

Mastercard shows strong, consistent growth momentum, more reliable than PayPal and slightly above Visa in revenue and cash flow growth, though it lacks Visa’s absolute scale.
52/62
Value Driver Analysis

55
Most firms, including Mastercard, Visa, and PayPal, sit tightly clustered around moderate operating margins with relatively high liability/asset ratios (0.6–0.9). This suggests the industry structurally leans on debt while delivering profitability.

A few firms (e.g., APCX, MFH, DIST) are clear outliers with negative or near-zero operating margins and weaker balance sheets, signaling instability versus peers.

The R² of 0.116 shows low explanatory power — leverage does not strongly predict operating margin across the group, meaning firms can sustain profitability despite higher liabilities.

Leaders like Mastercard and Visa prove that scale and efficiency allow high margins despite leverage, debt is not a limiting factor when business models are resilient.
55/62
Value Driver Analysis

56
With an R² of 0.989, ROA is highly correlated with liability asset ratio across firms — balance sheet strength is a key driver of asset productivity in this sector.

Mastercard, Visa, and PayPal cluster near the origin, signaling relatively balanced leverage and ROA compared to extreme outliers (e.g., IPSI with negative ROA but very high leverage).

Leaders like Mastercard and Visa maintain healthy ROA despite moderate liabilities, showing efficiency in asset deployment compared to smaller, riskier players.

Firms drifting away from the cluster with negative ROA are likely over-leveraged and underperforming, highlighting the danger of excessive debt without scale advantages.
56/62
Enterprise Breakdown - Revenue

57
With ~55% of revenue flowing to net income, Visa’s business model converts scale directly into bottom-line strength.

Mastercard balances costs and profits with lower COGS (~24%) and leaner SG&A (~15%) that allow Mastercard to achieve ~46% net income margin, still highly efficient.

PayPal is cost-heavy with high COGS (~54%) and SG&A (~13%) compress margins, leaving only ~13% net income margin, a structural disadvantage versus card networks.

Card networks (Visa/Mastercard) extract value through operating leverage and low variable costs, while PayPal remains more burdened by transaction and operating expenses.
57/62
Enterprise Breakdown - Liability- Equity

58
Mastercard leans on long-term debt with ~46% non-current liabilities, its balance sheet is more debt-weighted than peers, limiting equity cushion (only ~14%).

Visa is equity-strong with 41% equity share, Visa runs the most conservative capital structure, supporting stability and long-term resilience.

PayPal relies heavily on current liabilities withver 59% of its funding is short-term, showing dependence on working capital financing, which adds refinancing and liquidity risk.

Mastercard’s model bets on debt efficiency, Visa balances growth with equity strength, and PayPal faces higher structural fragility due to reliance on current liabilities.
58/62
Enterprise Breakdown - Detailed Asset

59
Mastercard's balanced structure — higher cash (17.6%) and strong intangibles (33.6%), showing liquidity strength while still heavily reliant on brand/IP.

Visa is the most asset-light model — ~48.5% intangibles dominate, but backed by steady cash (12.7%), reinforcing scalability without heavy tangible assets.

PayPal is very receivables-heavy — over 55.9% in receivables, much higher than peers, reflecting dependence on working capital tied to customer/merchant transactions.

Visa’s model maximizes intangible-driven efficiency, Mastercard balances liquidity with brand/IP, while PayPal’s reliance on receivables exposes it to higher credit and collection risks.
59/62