US Industrial Breakdown - Revenue: Value of Operations / SCs.

4
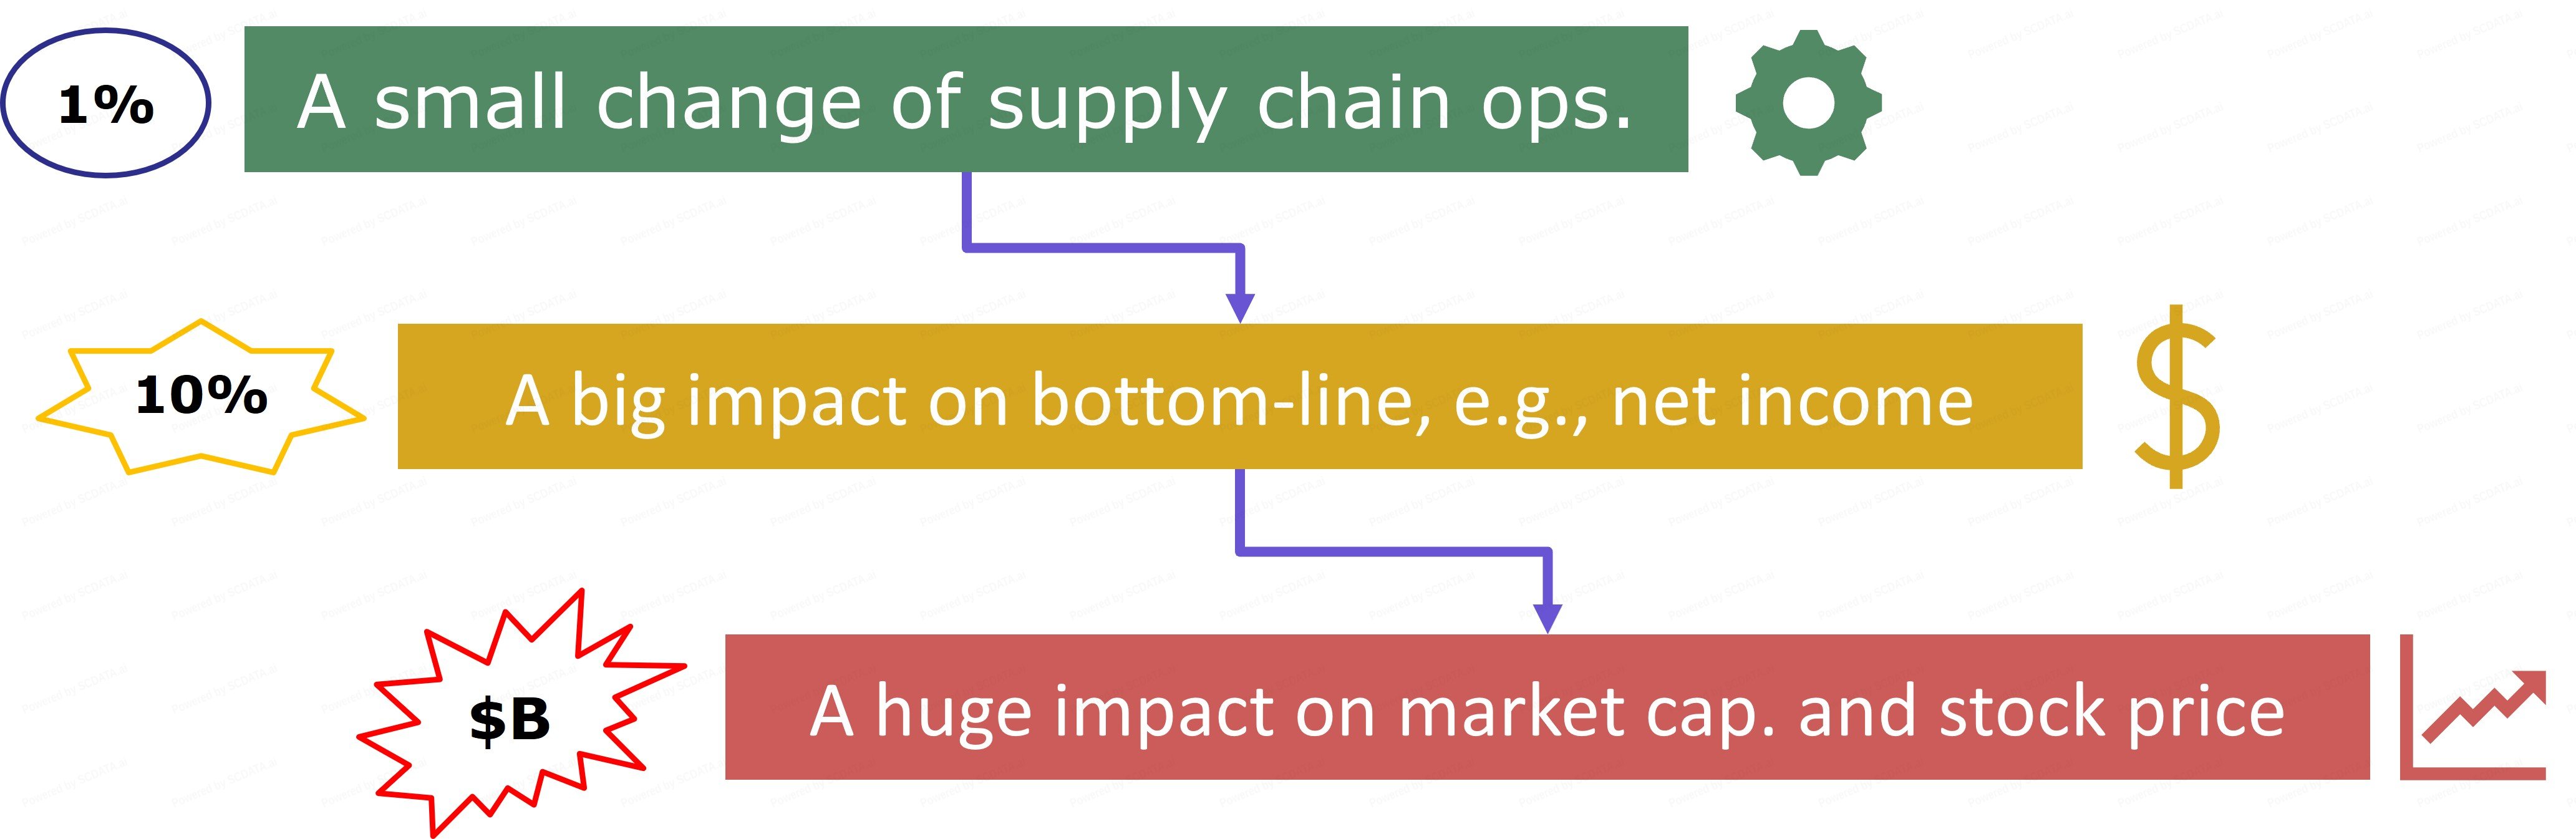
US revenue breakdown. COGS is the biggest cost component for all industries except financials. COGS > 50% revenue in 7 of 11 sectors. On the other-hand, net income is less than 10% for 7 of 11 sectors. Thus, a small change in COGS can result a huge change in net income. SG&A is 2nd largest cost component for most industry sectors.
4/25
US Industrial Breakdown - Revenue: Value of Operations / SCs.

5
US revenue breakdown. COGS is the biggest cost component for all industries except financials. COGS > 50% revenue in 7 of 11 sectors. On the other-hand, net income is less than 10% for 7 of 11 sectors. Thus, a small change in COGS can result a huge change in net income. SG&A is 2nd largest cost component for most industry sectors.
5/25
China Industrial Breakdown - Revenue: Value of Operations / SCs.

7
China: COGS accounts for a higher percentage of revenue in 8 of 11 sectors than the US except consumer discretionary, energy and financials. Net income accounts for a lower percentage of revenue in 8 of 11 sectors except consumer discretionary, financials and health care. SG&A 2nd biggest cost component.
7/25
India Industrial Breakdown - Revenue: Value of Operations / SCs.

8
India: similar importance of COGS and SG&A. Notably, energy companies are disproportionally large and highest COGS %. Thus, better operations / SCs can lead to significantly better financials and stock mkt performance for India energy sector!
8/25
Largest Markets 2024

10
Market Cap by Country: US 1st > sum of the 2nd to 11th
10/25
Total Market Cap Trend by Country 2018-2024

11
Top 3 countries in total market cap are US, China, and Japan, way above others. US fluctuated and increasing. China, peaked @ 2021. Japan, stable. The rest: India fast increasing, UK / France: steadily increasing, Germany: fluctuating and falling below Canada, ...
11/25
Total Market Cap Trend by Country 2018-2024

12
Total mkt cap has strong correlations to financials, such as, total net income, total operating cash flow, … The correlation is not perfect though, quite some noises.
12/25
Industrial Trend - Choose Your Own KPIs (Industry Total)

14
Put the results together, industry market cap is correlated to some industry financials, such as, industry net income and operating cash flow, but is not correlated to other industry financials, such as, the industry total revenue.
I also tried China, India, Japan, found similar correlations.
14/25
Enterprise Trend - Choose Your Own KPIs

17
Pick some of the world’s most valuable companies from various countries, like US, China, India, Japan and Germany, for instance, … We see mkt cap and net incomes moves quite closely together although not perfect.
17/25