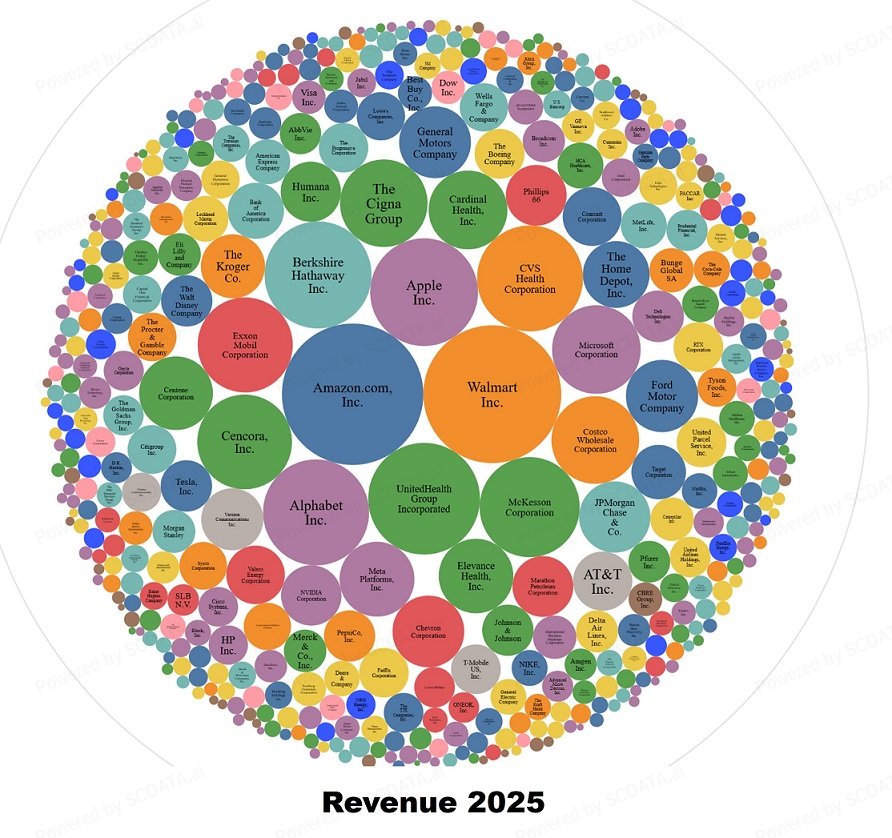
# of SP500 firms by state

6
California, Texas, New York and Illinois have the most SP500 firms! Most prosperous regions in the US
6/42
# of SP500 firms by state - bar chart

7
The bar chart shows more clearly the distribution of SP500 companies by state in 2025.
7/42
Largest states by revenue

8
California, Texas, New York, Washington have the highest revenue!
8/42
Most profitable state

9
California, Texas, New York, and Washington are way above other states in net income.
9/42
State carrying highest risk

10
New York has the highest liabilities / risk although it hasn’t the highest revenue / operating profit. CA’s risk is much lower than NY – higher paid & better job security?
10/42
Inventory by state

11
TX, CA, VA, WA hold the highest inventory, more jobs related to SCM and operations.
11/42
Where are IT firms in the US?

13
Want to work in IT? Clearly CA! More profit in CA than WA which ranks 2nd
13/42
Where are energy firms in the US?

14
Want to work in Energy? Clearly TX! More profit in TX than OK which ranks 2nd
14/42
Where are financial firms in the US?

15
Want to work in Financials? Clearly NY! More profit in NY than Nebraska (BRK) which ranks 2nd
15/42
Where are healthcare firms in the US?

16
Want to work in Healthcare? Clearly NJ, better than IN, CA which rank 2nd & 3rd
16/42
Comparing California, Texas and New York: They are good at different industries.

18
California vs. New York: CA is clearly dominated by IT companies while NY is dominated by financial companies.
18/42
KPI Distribution: CA > TX in pricing power.

19
CA has better the pricing power than TX because it has more companies with higher gross margin.
19/42
Revenue vs. Cost

21
Let’s first perform the revenue and cost analysis. In the US, In general, the higher cost, the higher revenue – a strong linear relations. However, different industries have different profitability or scalability of the industry. The revenue vs cost analysis of SP500 companies shows that different companies may have very different profitability, likely because they are in different industries. For instance, MSFT spent $153B and made $282B in 2025, Kroger spent $143B and made $147B.
21/42
Which industry has a higher pay-off / return for a lower cost? Easy $ vs. Hard $

24
MSFT and GM come from different industries. These examples imply that if you enter different industries, you may have very different money making potential! To see the impact of industry on profitability, that is, with the same amount of effort, how much money companies can make in various industries, we can perform a profit vs cost analysis. The slopes indicate the profitability of the industries. We can see that the best industries (smallest effort, biggest profit) in the US are IT and Financials. Consumer staples and health care made the least net income.
24/42
Growth potential by Revenue

27
The growth potential of each industry sector is shown here. Clearly, health care and IT had high growth rate in the past 8 years.
27/42
CAGR growth rates

28
CAGR = compound annual growth rate by industry sectors for the US. From 2016-2024, IT had the highest growth rate with a CAGR ~11% annually. Health care is the second ~ 9%. Telecom had the lowest ~2%.
28/42
Which industry has a higher pay-off / return for a lower cost? Easy $ vs. Hard $

29
MSFT and GM come from different industries. These examples imply that if you enter different industries, you may have very different money making potential! To see the impact of industry on profitability, that is, with the same amount of effort, how much money companies can make in various industries, we can perform a profit vs cost analysis. The slopes indicate the profitability of the industries. We can see that the best industries (smallest effort, biggest profit) in the US are IT and Financials. Consumer staples and health care made the least net income.
29/42
Industrials vs IT on profitability

32
SP500 IT firms are more profitable than SP500 industrials firms
32/42
Industrial vs IT on liabilities and risk

33
SP500: IT firms have a better liquidity ratio a lower liability / asset ratio, and has more cash each year and in total
33/42
Industrial vs IT on employees and valuation

34
Industrial firms hire more people than IT but IT firms have higher valuation.
34/42
Company analysis: IT Profit frontier (Operating margin vs revenue)

39
Operating Margin vs. Revenue analysis of the US IT industry in 2023 shows the profit frontier, showing the most profitable companies in each revenue class. That is, given the same revenue, the firms with the highest operating margin form the profit frontier. Clearly, Apple, Microsoft, Google, Meta and Visa are on the profit frontier and thus the best among their peers.
39/42
ROA vs Liability Asset ratio for IT

41
To measure risk, we use the risk vs. return analysis. Higher risk does not always give you a higher return. Which also means that you can have high return and low risk (liability) in the same time! This picture shows the risk and return of the SP500 IT firms. The four regions: low risk and high return (for example, Texas Instrument, Meta, Adobe, etc.), high risk and high return (example, Apple, MasterCard, Broadcom), low risk and low return (AMD, Salesforce), high risk and low return (HP, Oracle, IBM); companies in the last category may find it hard to survive.
41/42
 SCDATA
Update
SCDATA
Update